Download
1 / 1
10 likes | 90 Views
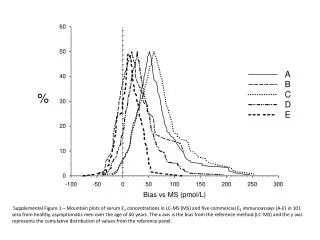
Analysis of serum E2 concentrations in healthy men over 40 using LC-MS and 5 immunoassays. Bias comparison and value distribution shown in mountain plots.

E N D
Supplemental Figure 1 – Mountain plots of serum E2 concentrations in LC-MS (MS) and five commercial E2 immunoassays (A-E) in 101 sera from healthy, asymptomatic men over the age of 40 years. The x axis is the bias from the reference method (LC-MS) and the y axis represents the cumulative distribution of values from the reference panel.