Download
1 / 1
10 likes | 218 Views
Comparative Genomics Tools in GMOD. Dave Clements 1 , Sheldon McKay 2 , Ken Youns-Clark 2 , Ben Faga 3 , Scott Cain 4 , and the GMOD Consortium

E N D
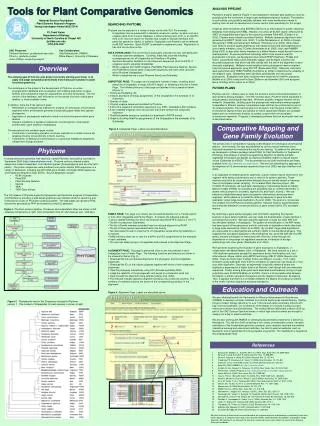
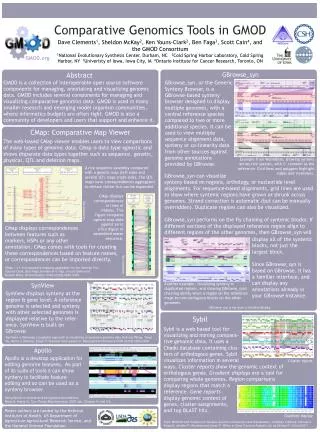
Comparative Genomics Tools in GMOD Dave Clements1, Sheldon McKay2, Ken Youns-Clark2, Ben Faga3, Scott Cain4, and the GMOD Consortium 1National Evolutionary Synthesis Center, Durham, NC 2Cold Spring Harbor Laboratory, Cold Spring Harbor, NY 3Univeristy of Iowa, Iowa City, IA 4Ontario Institute for Cancer Research, Toronto, ON GMOD.org Abstract GMOD is a collection of interoperable open source software components for managing, annotating and visualizing genomic data. GMOD includes several components for managing and visualizing comparative genomics data. GMOD is used in many smaller research and emerging model organism communities, where informatics budgets are often tight. GMOD is also a community of developers and users that support and enhance it. GBrowse_syn GBrowse_syn, or the Generic Synteny Browser, is a GBrowse-based synteny browser designed to display multiple genomes, with a central reference species compared to two or more additional species. It can be used to view multiple sequence alignment data, synteny or co-linearity data from other sources against genome annotations provided by GBrowse. CMap: Comparative Map Viewer The web-based CMap viewer enables users to view comparisons of many types of genomic data. CMap is data type agnostic and shows disparate data types together such as sequence, genetic, physical, QTL and deletion maps. Example from WormBase, showing synteny across five species, with C. remanei as the reference. Grid lines and polygons highlight indels and inversions. A rice sequence assembly compared with a genetic map (left side) and several QTL maps (right side). The QTL maps have correspondences aggregated to reduce clutter but can be expanded. GBrowse_syn can visualize synteny based on regions, orthology, or nucleotide level alignments. For sequence-based alignments, grid lines are used to show where syntenic regions have grown or shrunk across genomes. Strand correction is automatic (but can be manually overridden). Duplicate regions can also be visualized. GBrowse_syn performs on the fly chaining of syntenic blocks: If different sections of the displayed reference region align to different regions of the other genomes, then GBrowse_syn will CMap displays correspondences as lines or ribbons. This figure compares optical map data against an in silico digest of assembled maize sequence. Gramene.org CMap displays correspondences between features such as markers, HSPs or any other annotation. CMap comes with tools for creating these correspondences based on feature names, or correspondences can be imported directly. display all of the syntenic blocks, not just the largest block. Since GBrowse_syn is based on GBrowse, it has a familiar interface, and can display any annotations already in your GBrowse instance. Gramene.org CMap 1.01: A comparative mapping application for the Internet, Ken Youens-Clark, Ben Faga, Immanuel V. Yap, Lincoln Stein and Doreen Ware, Bioinformatics, 2009 25(22):3040-3042 Another example, visualizing synteny in duplicated regions, and showing GBrowse_syn's chaining ability when a region on the reference maps to non-contiguous blocks on the other genomes. SynView SynView displays synteny at the region & gene level. A reference genome is selected and synteny with other selected genomes is displayed relative to the refer-ence. SynView is built on GBrowse. GBrowse_syn is the work of Sheldon McKay Sybil Sybil is a web based tool for visualizing and mining compara-tive genomic data. It uses a Chado database containing clus-ters of orthologous genes. Sybil SynView: a GBrowse-compatible approach to visualizing comparative genome data Haiming Wang, Yanqi Su, Aaron J. Mackey, Eileen T. Kraemer and Jessica C. KissingerBioinformatics 2006 22(18):2308-2309 Apollo Apollo is a desktop application for editing genome features. As part of its suite of tools it can show synteny to facilitate feature editing and so can be used as a synteny browser. visualizes information in several ways. Cluster reports show the genomic context of orthologous genes. Gradient displays are a tool for comparing whole genomes. Region comparisons Cluster report display regions that match a reference. Gene reports display genomic context of genes, cluster assignments, and top BLAST hits. Using Apollo to browse and edit genome annotations. Misra S, Harris N., Curr Protoc Bioinformatics. 2006 Jan; Chapter 9: Unit 9.5. Poster authors are funded by the National Institutes of Health, US Department of Agriculture Agricultural Research Service, and the National Science Foundation. Gradient display Sybil: Methods and Software for Multiple Genome Comparison and Visualization. Jonathan Crabtree, Samuel V. Angiuoli, Jennifer R. Wortman and Owen R. White; in Gene Function Analysis, ed. by Michael F. Ochs (2007)