Download

1 / 24
240 likes | 362 Views
Chapter 12 Economic Fluctuations. Aggregate Demand. This is the connection among: Inflation Unemployment Level of spending real output in the Canadian economy The relationship between: The general price and GDP (expenditure) Real expenditure = Spending – (Spending / GDP Deflator).

E N D
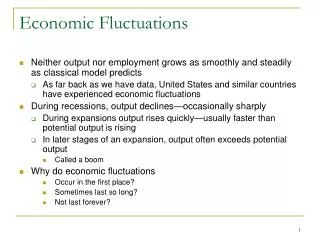
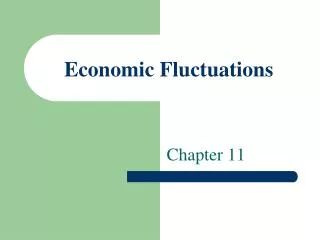
Aggregate Demand • This is the connection among: • Inflation • Unemployment • Level of spending real output in the Canadian economy • The relationship between: • The general price and GDP (expenditure) • Real expenditure = Spending – (Spending / GDP Deflator)
Demand Curve • Downward Slope • As price goes up, demand goes down • As price goes down, demand goes up
Market Demand and Supple Curves for Strawberries Change in Supply on Equilibrium Price ($) S0 Market Demand and Supply Schedules for Strawberries 3.00 S1 Surplus 2.00 a b 1.00 D 0 1 3 5 7 9 11 13 15 Quantity (millions of kilogram per year)
Market Demand and Supple Curves for Strawberries Change in Demand on Equilibrium Price ($) S Market Demand and Supply Schedules for Strawberries 3.00 b 2.00 a Shortage D1 1.00 D0 0 1 3 5 7 9 11 13 15 Quantity (millions of kilogram per year)
Movement Along the Demand curve is Caused by • Wealth • Assets such as money in bank accounts or RSPS have unchanging nominal values • But their real value change • Real value for asset = nominal value / price level • Therefore, when price levels rise, the real value of assets decreases, this gives people less wealth and lower spending causing real expenditure to decrease
Foreign Trade • As the Canadian price level rises, so do the export prices, foreign markets will buy less(decrease in export), but we will import more (because their price level is lower than ours). Hence, net export decrease (X – M) and real expenditure decrease
Factors causing shifts in the demand curve • Consumption • Disposable Income • Is the amount of money that can be spent, the more spending the more real expenditure(shift to the right). • Consumer expectations • Cause consumers to spend more or less depending on if they predict the price will rise or fall
Interest Rate • Play a roll when it comes for people making big purchases, lower interest rates cause consumers to borrow more and spend more making total expenditures increase, and vice versa • Investment • Investment refer to planned investments, not unintentional changes in inventory • Rate of Return • Is the percentage change of the constant extra profit provided per year generated by the investment
Investment Demand • Relies on interest rates, production costs and technological breakthroughs. As interest rates decrease, companies will be able to borrow more to pursue new investments. Taxes may cause production cost to increase, and fewer investments will be pursued(hence less expenditure and a shift to the left).
Net Exports • When foreign incomes and exchange rate change exports will be affected. If foreign incomes rise, they will import more causing us to export more (net exports increase). When the dollar value increases their price level will be increased and exports will decrease.
Shifts in the Aggregate Demand Curve • Aggregate demand increase, thereby shifting the AD curve to the right /left, with the following: • An increase/decrease in consumption due to • A rise/fall in disposable income • A rise/fall in wealth • An expected rise/fall in prices or incomes • A fall/rise in interest rate
An increase/decrease in investment due to • A fall/rise in interest rates • An expected rise/fall in profit • A fall/rise in production costs • An increase/decrease in government purchases • An increase/decrease in net exports due to • A rise/fall in foreign incomes • A fall/rise in the value of the Canadian dollar
Aggregate Supply • Aggregate Supply • The relationship between the general price level and real output produced in the economy • Aggregate Supply Curve • The relationship between the general price level and real output expressed as a graph
Change in Aggregate Supply • Aggregate supply factor • Variables that change total output at all price levels • Input Prices • Short-run increase in aggregate supply • An increase in total output at all price levels, with no change in potential output
Resource Supply • Long-run increase in aggregate supply • An increase in total and potential output at all price levels • Productivity • Is the real output produced per unit of input over a given period • Specifically labor productivity for example would be calculated as follows • Labour productivity = Real output Total hours worked • Here we divide the nations real output by the total number of hours worked by its labour force
Government Policies • Government policies can also influence aggregate supply through their effects on the business environment in an economy • Example • Suppose taxes rise for businesses and households. Because the after taxes on supplying economic resources are reduced, business and households may reduce the resources they supply at every price level. As a result real output falls, causing a long-run decrease in aggregate supply
Equilibrium • Aggregate Demand and Supply • An economy’s equilibrium price level and real output occur at the intersection of the aggregate demand and aggregate supply curves
Inventory Changes • Unintended changes in inventories cause price levels and real outputs to reach equilibrium. There are two possible changes: an inventory increase or decrease • Results of a inventory increase cause a surplus and the prices of individual products decrease, pushing down the general price level. This is known as a positive unplanned investment. The decrease influences both households and businesses to buy and creates equilibrium
Results of an inventory decrease cause a shortage. This leads to a decrease in inventory and therefore the prices rise, this is known as negative unplanned investment. Buyers decrease spending, businesses raise real output and this creates equilibrium • The role of unplanned investment players a central role of stabilizing the economy. It is identical to the discrepancy between aggregate demand and aggregate supply. (Has a monetary value)
Injection and Withdrawals • Injection • Are additions to an economy’s income spending stream. There are three flows • Investment (I) • Government Spending (G) • Exports (X) • Withdrawals • Are deductions from an economy’s income-spending stream. There are three flows: • Saving (S) • Taxes (T) • Imports (M)
To understand we look at related pairs of injections and withdrawals • Investment and Savings • Households provide personal savings into the loanable funds market. Most of these funds are borrowed by businesses for investment. However the amount saved and the amount invested in an economy are not equal for three reasons. • Companies keep a portion of their profit to reinvest • Government also borrow • Foreign exchange flow must also be considered
Government Purchases and Taxes • Governments purchases usually exceed taxes, and to make up for the discrepancy governments borrow money from financial markets. In the odd case when taxes exceed government spending they can use the money to pay off debt • Exports and Imports • Foreign lending tends to be greater than foreign borrowing, therefore the surplus in lending makes up for the short fall in net exports • Total injections and withdrawal • Have an important connection that applies when an economy is at equilibrium. Total injections are the sum of I + G + X and total withdrawals are the sum of S + T + M. This determines the state of the economy
Equilibrium vs. Potential Output • If an economy’s equilibrium occurs at its potential output, then unemployment at equilibrium equals the natural unemployment rate • Recessionary Gap • Occur when the amount by which equilibrium output falls short of potential output • Inflationary Gap • Occur when the amount by which equilibrium output exceeds potential output