Download
1 / 7
70 likes | 345 Views
Single User License: US $ 7999;<br>Request for Sample @ http://www.reportsnreports.com/contacts/RequestSample.aspx?name=423852<br>

E N D
The FTTx coverage, conversion and capex: worldwide trends and forecasts 2015–2020 Order this report by calling +1 888 391 5441 or Send an email to sales@reportsandreports.com with your contact details and questions if any. Published: September 2015 Single User PDF: US$ 7999 © ReportsnReports.com / Contact sales@reportsandreports.com
The FTTx coverage, conversion and capex: worldwide trends and forecasts 2015–2020 "By 2020, over half the world will have access to FTTx or cable broadband, which will make up 80% of broadband connections." . Fixed broadband continues to grow worldwide. This is mainly because the levels and types of usage that are typical of fixed broadband continue to outstrip the capabilities of mobile networks, in terms of either total system capacity or achievable reliable speeds. Future demand is unquestionably strong. This report analyses and forecasts coverage (premises passed), conversion (active connections as a percentage of premises passed) and capex for FTTx architecture and technologies during 2011–2020. Single User License: US $ 7999; Request for Sample @ http://www.reportsnreports.com/contacts/RequestSample.aspx?name=423852 Order this report by calling +1 888 391 5441 or Send an email to sales@reportsandreports.com with your contact details and questions if any. © ReportsnReports.com / Contact sales@reportsandreports.com
The FTTx coverage, conversion and capex: worldwide trends and forecasts 2015–2020 Data Coverage Coverage (premises passed) Conversion (premises with active connections as a percentage of premises passed) Capex (split into network and connection) Split by technology: FTTC/VDSL FTTB/VDSL FTTB/LAN FTTP (split into incumbent and alternative operator) cable DOCSIS3.0 Note: Capex is not provided for cable DOCSIS3.0. Order this report by calling +1 888 391 5441 or Send an email to sales@reportsandreports.com with your contact details and questions if any. © ReportsnReports.com / Contact sales@reportsandreports.com
The FTTx coverage, conversion and capex: worldwide trends and forecasts 2015–2020 List of Figures Figure 1: Conversion rates for NGA overall, and FTTP and FTTx , worldwide, 2011–2020Figure 2: NGA coverage by technology, worldwide, 2011–2020Figure 3: Fixed broadband active connections, by technology, and NGA’s share of connections, worldwide, 2011–2020Figure 4: FTTx capex by market type, and availability and affordability of NGA, worldwide, 2013–2020Figure 5: Incumbent operator FTTC or FTTB coverage, by region, 2015 and 2020Figure 6: Cost of deploying FTTx by centile, new and old cost models (illustrative)Figure 7: Bandwidth consumed by pixel resolution and type of MPEG-4 compressionFigure 8: Emerging economies’ shares of worldwide FTTx premises passed and connected, and emerging economies’ FTTx coverage, 2011–2015Figure 9: Conversion rates for NGA by technology, worldwide, 2011–2015Figure 10: FTTx net additions by technology, worldwide, 2011–2015Figure 11: NGA coverage by technology, Western Europe, 2014–2020Figure 12: FTTx capex by technology, Western Europe, 2014–2020Figure 13: Conversion rates for NGA overall, and FTTP and FTTx , Western Europe, 2014–2020Figure 14: Active connections per premises, by technology, Western Europe, 2014–2020Figure 15: NGA coverage by technology, Central and Eastern Europe, 2014–2020Figure 16: FTTx capex by technology, Central and Eastern Europe, 2014–2020 Order this report by calling +1 888 391 5441 or Send an email to sales@reportsandreports.com with your contact details and questions if any. © ReportsnReports.com / Contact sales@reportsandreports.com
The FTTx coverage, conversion and capex: worldwide trends and forecasts 2015–2020 Figure 17: Conversion rates for NGA overall, and FTTP and FTTx , Central and Eastern Europe, 2014–2020Figure 18: Active connections per premises, by technology, Central and Eastern Europe, 2014–2020Figure 19: NGA coverage by technology, Middle East and North Africa, 2014–2020Figure 20: FTTx capex by technology, Middle East and North Africa, 2014–2020 Single User License: US $ 7999; Inquire for Discount @ http://www.reportsnreports.com/contacts/Discount.aspx?name=423852 Figure 21: Active connections per premises, by technology, Middle East and North Africa, 2014–2020Figure 22: Conversion rates for NGA overall, and FTTP and FTTx , Middle East and North Africa, 2014–2020Figure 23: FTTP premises passed and connected, and FTTP conversion rates, Gulf Co-operation Council states, 2014–2020Figure 24: NGA coverage by technology, Sub-Saharan Africa, 2014–2020Figure 25: NGA capex by technology, Sub-Saharan Africa, 2014–2020 Order this report by calling +1 888 391 5441 or Send an email to sales@reportsandreports.com with your contact details and questions if any. © ReportsnReports.com / Contact sales@reportsandreports.com
The FTTx coverage, conversion and capex: worldwide trends and forecasts 2015–2020 Figure 26: Conversion rates for NGA overall, and FTTP and FTTx , Sub-Saharan Africa, 2014–2020Figure 27: Active connections per premises, by technology, Sub-Saharan Africa, 2014–2020Figure 28: NGA coverage by technology, emerging Asia–Pacific, 2014–2020Figure 29: FTTx capex by technology, emerging Asia–Pacific, 2014–2020Figure 30: Active connections per premises, by technology, emerging Asia–Pacific, 2014–2020Figure 31: Conversion rates for NGA overall, and FTTP and FTTx , emerging Asia–Pacific, 2014–2020Figure 32: FTTx premises passed and connected, conversion rates, China, 2014–2020Figure 33: NGA coverage by technology, developed Asia–Pacific, 2014–2020Figure 34: FTTx capex by technology, developed Asia–Pacific, 2014–2020Figure 35: Conversion rates for NGA overall, and FTTP and FTTx , developed Asia–Pacific, 2014–2020Figure 36: Active connections per premises, by technology, developed Asia–Pacific, 2014–2020Figure 37: NGA coverage by technology, North America, 2014–2020Figure 38: FTTx capex by technology, North America, 2014–2020Figure 39: Conversion rates for NGA overall, and FTTP and FTTx , North America, 2014–2020Figure 40: Active connections per premises, by technology, North America, 2014–2020 Complete report is spread across 51 pages and available @ http://www.reportsnreports.com/reports/423852-the-fttx-coverage-conversion-and-capex-worldwide-trends-and-forecasts-2015-2020.html Order this report by calling +1 888 391 5441 or Send an email to sales@reportsandreports.com with your contact details and questions if any. © ReportsnReports.com / Contact sales@reportsandreports.com
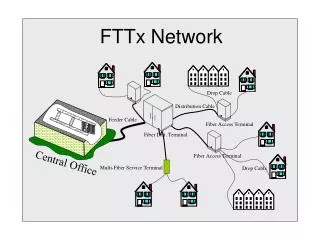
The FTTx coverage, conversion and capex: worldwide trends and forecasts 2015–2020 Figure 41: NGA coverage by technology, Latin America, 2014–2020Figure 42: FTTx capex by technology, Latin America, 2014–2020Figure 43: Conversion rates for NGA overall, and FTTP and FTTx , Latin America, 2014–2020Figure 44: Active connections per premises, by technology, Latin America, 2014–2020Figure 45: Countries covered in this report, by regionFigure 46: Definitions used in this reportFigure 47: Capex model outlineFigure 48: Basic overview of FTTx network topologies and elementsFigure 49: Baseline capital unit cost assumptions, FTTC/VDSL and FTTB/VDSLFigure 50: Baseline capital unit cost assumptions, FTTH/GPON Browse All Reports on IT & Telecommunication Market. Contact sales@reportsandreports.com / Call +1 888 391 5441 for further information on “The FTTx coverage, conversion and capex: worldwide trends and forecasts 2015–2020” report OR for any other market research and intelligence needs you may have for your business. Order this report by calling +1 888 391 5441 or Send an email to sales@reportsandreports.com with your contact details and questions if any. © ReportsnReports.com / Contact sales@reportsandreports.com