Download
1 / 66
660 likes | 838 Views
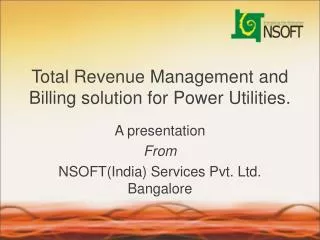
Total Revenue Management and Billing solution for Power Utilities. A presentation From NSOFT(India) Services Pvt. Ltd. Bangalore. About NSOFT(India). An ISO 9001-2000 Software solution Company In operation since 1996. In the Total Revenue Management Services since 1998.

E N D
Total Revenue Management and Billing solution for Power Utilities. A presentation From NSOFT(India) Services Pvt. Ltd. Bangalore
About NSOFT(India) • An ISO 9001-2000 Software solution Company • In operation since 1996. • In the Total Revenue Management Services since 1998. • In the Power sector since 1999. • Working on CMMi level 4 certification.
Experience Utility Revenue Management • Expertise in handling Water Supply Utilities. • Expertise in Handling Power Utility Companies. • Expertise in handling the Financial Accounting and works management for Utility Companies.
Experience Contd... • Implemented across 100 sub divisions in Karnataka. Total coverage across 5 utility companies covering 53 lakh consumers. • Implemented in Gujarat in two utilities and carrying out Live billing across 2.9 lakh consumers in 23 sub divisions. • Implementation in Progress in Allahabad for 1.75 lakh consumers.
Total Revenue Management • Complete Digitisation of the consumer and Utility Data. • Building this data on a Geographical Information System platform. • Decentralised – On the spot billing through Hand held devices. • Bill Collection – On the spot or through different mechanisms of collection.
Security Features • Built in workflow with security features built in to prevent any manipulation of data. • Data flows through n-tiered workflow layers with users given role based permissions to create/access / approve transactions. • All access to backend database completely cut-off and modifications allowed through transactions which are logged to facilitate audit trail tracking.
Integration of data on a Web Server through dedicated communication channels. • Preparation of MIS Reports and also reports to monitor the day to day work. • Integration of Revenue Management with enterprise level Project accounting system.
Capability of the software • Architectureof Software • The software is available in both theClient Server andWeb enabled platforms. • The software addresses the complete needs of the Revenue Management for the utility companies. • The scope covers • Maintaining the Consumer ledgers • Billing data preparation on a daily basis. • Revenue Collection monitoring.
Architecture Diagram Cash Counter Cash Counter Cash Counter Customer’s Site Dial up /Leased Lines connectivity Section Office/ SDO / DO Data Downloading to Spot Billing Machine Data Receive Data Sending Meter Reader Bill Data Uploading From SBM Spot Billing Machine (SBM) • Generating the Bills • Generating the Receipts • Taking the Complaints & Issuing the Acknowledgment
SDO / Section Office 1 SDO 2 / Section Office 2 SDO 3 / Section Office 3 Customer’s Site Wide Area Connectivity (Leased Lines / Internet etc- Data Aggregation SDO/DO/CO/HO Data Receive Data Sending Data Downloading to Spot Billing Machine CashCntr Spot Billing Machine (SBM) Bill Data Uploading From SBM Meter Reader • Generating the Bills • Generating the Receipts • Taking the Complaints & Issuing the Acknowledgment
Enterprise-wide Data Integration NSOFT HO/ Central Data warehouse MIS system Enterprise Integration (Uploads all transactional data) Office-Datalink (Extracts data / Integrates Master Data ) Office-Datalink (Extracts /Integrates Master data) Section Office a) LT Billing b) Collection c) MIS Reports d) Fin.Accounts e) Customer Mgt. SDO/DO/ERO/CO a) HT Billing b) Collection c) MIS Reports d) Fin. Accounts e) Customer Mgt. MIS Data for Billing Collection Meters etc.
Capability of the software • Integration of collection with the Demand on a daily basis. • Integration of data from multiple locations to a central database. • Facility to produce the Daily Demand Collection and Balance Report for the consumer / Meter Reader / Sub Division / Division / Corporate Office. • Generation of reports relating to Revenue Management and Presentation of the Reports on the Web for authorised consumers / Utility Staff. • Energy Auditing Transformer Center wise.
Physical Architecture For Billing- Proposed. • The consumer master should reside at the local billing center. • The collections should be updated to the billing center on a daily basis. • The consumers data is kept current and helps in Complaint Management. • The billed consumers tour plan is made. • The Meter Reader will walk across the consumers houses and generate the bills through Spot Billing Machines
Validation of consumers • Bar-coding of the Meters with a combination of Meter Serial Numbers / Consumer Numbers. • Labels [ Polyester ] are fixed to the meters by our staff. • Bar-code Reader equipped SBM’s. • The input is restricted to the I R entry. • Reduced Inputs • Accurate consumer identification. • This facilitates Meter management Info reconciliation with the Consumer Numbers.
Bar-Code Printing on the Bill • The bill generated through the SBM’s can have a bar-code printed for use in Cash Counters. • The Vertical bar-code will have 20 characters on Code 128 C standard. • 11 Characters – Consumer number • 8 Characters – Amount [ Max of 9.99 lakhs]
The data is downloaded at the sub division office in to the server. • In Web enabled platform the data is updated to a central server. • The MIS reports are generated at the sub division. • Energy auditing facilitated.
Energy Auditing • Consumers are mapped to Transformer Centers. • Transformers are linked to Feeders. • Consumption of the Transformer Centers are monitored through Metering. • The billing cycles are re-organised to ensure that the Transformer Centers are read on the same day as the consumers linked to Transformers.
The consumption of the Transformers are compared to the Consumers and the difference in consumption is the loss of Energy which has to be traced. • This includes both the Technical as well as Commercial Losses. • The spot billing machines are equipped to generate the Loss Percentages soon after the day’s meter reading is completed.
Interface to Other Systems • Interface to Geographical Information System. • Interface to Enterprise wide Project and Works accounting system. • Payroll maintenance