Download
1 / 30
300 likes | 406 Views
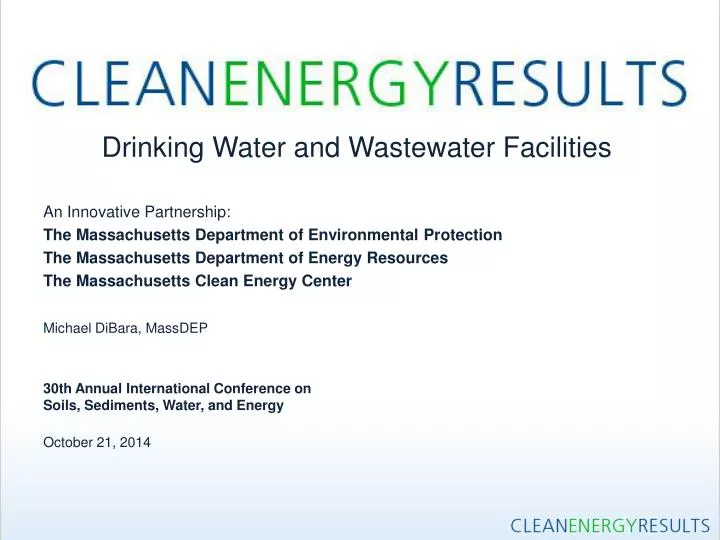
Drinking Water and Wastewater Facilities An Innovative Partnership: The Massachusetts Department of Environmental Protection The Massachusetts Department of Energy Resources The Massachusetts Clean Energy Center Michael DiBara, MassDEP

E N D
Drinking Water and Wastewater Facilities An Innovative Partnership: The Massachusetts Department of Environmental Protection The Massachusetts Department of Energy Resources The Massachusetts Clean Energy Center Michael DiBara, MassDEP 30th Annual International Conference on Soils, Sediments, Water, and Energy October 21, 2014
Clean Energy Results Program • Launched in November, 2011 • MassDEP, DOER and CEC partnership • To advance environmental protection by promoting the development of renewable energy and energy efficiency projects in Massachusetts Barnstable Water Pollution Control Facility 819 kW
Topics today: CERP in BRP • MA Energy Pilot • Energy Leaders Roundtable Group • In-Conduit Hydropower Project • MA Return-on-Investment Model • Moving energy-saving projects forward
Water / Wastewater Treatment in MA • 370 public facilities • $150M / year Impacts • 1 billion kWhs • 1 million tons (CO2)
MA Energy Management Pilot (2007 – 2010) Public (7) Water & (7) Wastewater Facilities MA Dept. of Environmental Protection MA Executive Office of Energy / Environmental Affairs MA Dept of Energy Resources EPA New England MA Renewable Energy Trust UMass Amherst – Northeast CHP Center Private Every Major Investor-Owned Electric & Gas Utility Non Profit Consortium for Energy Efficiency
14 Pilot Facilities: Recommendations Massachusetts’ Energy Pilot(2007 – 2010) Efficiency: Save $2M / Year Green Power: Save $1.7M / Year
ARRA – Green Infrastructure Recovery & Reinvestment: Clean Energy & the Environment Jump-start “Green”projects: 20% of SRF ARRA • Fully Implement Pilot & Other “Green” projects • (7) Wastewater Plants: $ 34.8 M • (7) Water Plants: $ 8.2M • $ 43.0M • (7) Others $ 23.1M • Total $ 66.1M
City of PittsfieldWastewater Treatment Plant Aeration Upgrade - Diffused Air w / Turbo Blowers 1,584 kW solar PV CHP Upgrade Overall 90% reduction in electrical costs, saving $660,000 / yr
Greater Lawrence Sanitary DistrictWastewater Treatment Plant • Install VFDs / Premium Efficiency Motors • Operational, Aeration, Water System, Lighting Improvements • Save ~$637,000 / yr in Electric Costs • Sludge digester &HVAC improvements Save ~$350,000 / yr in Natural Gas Costs • Est. Annual CO2 Emission Reductions: 2,035 tons
Town of ChelmsfordCrooked Spring Water Treatment Plant • Feasibility Study: UMass – Lowell • Producing 500,000 kWh / year (41%) • Saving $ 73,000 / yr (Electricity/ REC) • Real Time power monitoring (plant / public) • http://www.powerdash.com/systems/1000277/ 485 kW solar PV
Results: National Model Facilities saving $5 million annually 10 Megawatts of Clean Energy installed 23,000 tons of GHG emission reductions / year
Mass Energy Leaders Roundtable(2010 – 2014) • Coalition of state, federal, community & energy efficiency providers • Each meeting has a technical presentation, a presentation from a water utility, a discussion on energy management planning, and a site visit.
Integrated Approach – To Encourage Energy benchmarking Energy audits Renewable energy assessments EPA Energy Management Plan – Do – Check - Act Model Financial Assistance
In-Conduit Hydropower: Alden Lab Three parts of the project ‘Reports & Screening Tool’ on MassDEP’s website 1. Technology research 2. Potential for installations in Massachusetts 3. Screening tool to allow facilities to estimate potential energy generation & economic / environmental benefits
Existing Technologies Courtesy: Toshiba Courtesy: ABS Alaska Courtesy: Canyon Hydro Slide courtesy of Alden Research Laboratory (C. Fay) • Many turbine technologies reviewed • 28 included in report
Typical Layout (1) Slide courtesy of Alden Research Laboratory (C. Fay)
Pittsfield Water - Coltsville Flow Control Station Project Slide courtesy of AECOM (D. Gove) • Project to replace old flow control station • 2 to 14 mgd flows w/ ~60 psi pressure reduction • $3 million construction • 62 kW Cornell hydro turbine • Revenue generated: • ~$14,000 sale of power • ~10,000 Class I REC’s
Goal: Return on Investment The Power of Positive Cash Flow Objective: To develop a Financial Assistance / Partnership Model using energy-saving projects that will generate positive cash flow for cities and towns that can be reinvested back into public drinking water and wastewater infrastructure.
Bundling Energy-Saving Projects Cash Flow ($) = Revenues - Costs
Reducing Operating Costs & Reinvesting in your Facility • Quantify energy & cost savings • Energy-savings can boost your bottom line & reduce your carbon footprint • Pay for wasted energy or reinvest it in your facility (people / equipment / assets)
2014 DW & WW Clean Energy ‘Gap’ Grants through MA DOER http://www.mass.gov/eea/grants-and-tech-assistance/guidance-technical-assistance/ agencies-and-divisions/doer/doer-procurements.html • Partnership between MA DOER, Mass DEP & MA CEC • $1,700,000 in grant funding • Max grant $200,000 Timelines • Feb 26, 2014 – Grant Announcement • April 23, 2014 – Close of Applications • June 3, 2014 – Grant Awards
2014 DW & WW Clean Energy ‘Gap’ Grants through MA DOER ROI: $1.7 M gap grant $11M of Projects
Projected Results: ‘Gap’ Funding • 31 Energy-saving projects moving forward • Energy efficiency & on-site clean energy generation • 1,500 kW (CHP), 4 solar PV (497 kW), water-source heat pump • Approx. $1.2M in annual cost savings for facilities • Approx. 15,300,000 kWh in annual electricity savings or on-site power generation • GrantAwards: http://www.mass.gov/eea/pr-2014/water-facilities.html
In summary, Facilities can continue to pay their existing / rising energy bills or they can act on their identified energy-saving opportunities
Thank you! Contacts • Michael DiBara (508) 767-2885 Michael.DiBara@state.ma.us • Ann Lowery (617) 292-5846 Ann.Lowery@state.ma.us AND + DOER’s Green Communities Coordinators in each MassDEP regional office