Download
1 / 24
240 likes | 336 Views
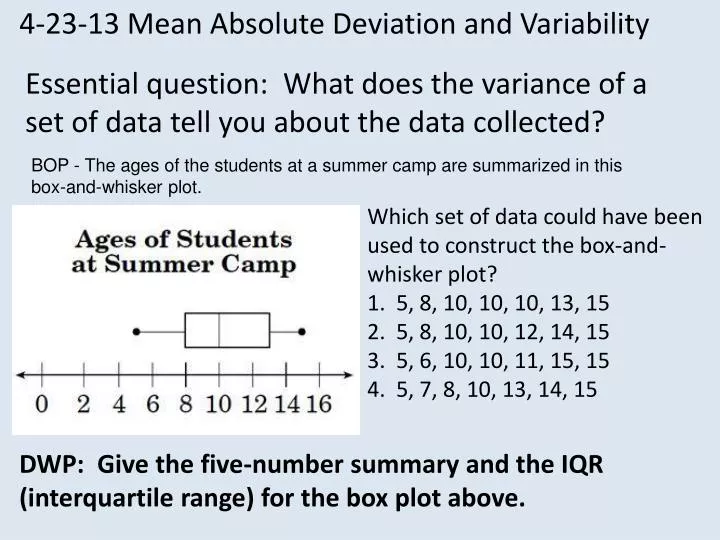
4-23-13 Mean Absolute Deviation and Variability. Essential question: What does the variance of a set of data tell you about the data collected?. BOP - The ages of the students at a summer camp are summarized in this box-and-whisker plot.

E N D
4-23-13 Mean Absolute Deviation and Variability Essential question: What does the variance of a set of data tell you about the data collected? BOP - The ages of the students at a summer camp are summarized in this box-and-whisker plot. Which set of data could have been used to construct the box-and-whisker plot? 1. 5, 8, 10, 10, 10, 13, 15 2. 5, 8, 10, 10, 12, 14, 15 3. 5, 6, 10, 10, 11, 15, 15 4. 5, 7, 8, 10, 13, 14, 15 DWP: Give the five-number summary and the IQR (interquartile range) for the box plot above.
Which set of data could have been used to construct the box-and-whisker plot? 5, 8, 10, 10, 10, 13, 15 5, 8, 10, 10, 12, 14, 15 5, 6, 10, 10, 11, 15, 15 5, 7, 8, 10, 13, 14, 15 The correct answer is A.
Write the information below in your Study Guide Variability - Degree to which data are spread out around a center value
http://www.mrmaisonet.com/index.php?/Statistics-Video/Mean-Absolute-Deviation.htmlhttp://www.mrmaisonet.com/index.php?/Statistics-Video/Mean-Absolute-Deviation.html
What is the MAD for this data set? Step 1: Find the mean Step 2: Find the distance between each data value and the mean. Step 3: Find the averages of the differences.
What is the MAD for this data set? Solution: The mean is 5. The MAD is the average variability of the data set. To find the MAD: What does the mean absolute deviation tell us? This value indicates that on average family size varies 2.89 from the mean of 5.
CC Investigation Problem 5.4 Paige’s lacrosse team scored the following numbers of goals In the first six games of the season: 7, 6, 17, 8, 7, 9 What is the mean number of goals scored? Show your work. What is the distance of each data value from the mean? 1. What is the total distance of all the data points from the mean? 2. What is the mean absolute deviation of the data? What does the mean absolute deviation tell you about the numbers of goals scored? Do you notice any value that does not follow the pattern of the rest of the data? Explain what makes that value unusual.
The number of goals scored is on average, about 2.67 goals less than or about 2. 67 goals greater than the mean. Yes; the score of 17 is much higher than the rest of the score.
ROLLER COASTERS - The table shows the maximum speeds of eight roller coasters at an amusement park. Find the mean absolute deviation of the set of data. Describe what the mean absolute deviation represents.
You can compare the mean absolute deviations for two data sets. A data set with a smaller mean absolute deviation has data values that are closer to the mean than a data set with a greater mean absolute deviation.
1. 2. Write a few sentences that comparing their variation.
Exit Ticket What does the variance of a set of data tell you about the data collected? Homework: Be sure you have corrections for geometry handouts.