Download
1 / 28
280 likes | 297 Views
This presentation at the Computing in High Energy and Nuclear Physics Conference in 2007 showcases CMS Online Web-Based Monitoring and Remote Operations tools, emphasizing the need for worldwide collaboration in high-energy physics. It covers the justification, physical installation, web services, and database utilization to efficiently manage CMS data.

E N D
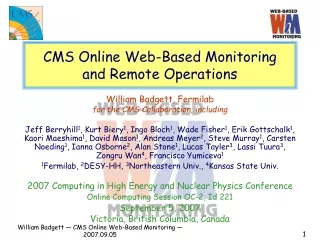
CMS Online Web-Based Monitoringand Remote Operations William Badgett, Fermilab for the CMS Collaboration, including Jeff Berryhill1, Kurt Biery1, Ingo Bloch1, Wade Fisher1, Erik Gottschalk1, Kaori Maeshima1, David Mason1, Andreas Meyer2, Steve Murray1, Carsten Noeding1, Ianna Osborne2, Alan Stone1, Lucas Tayler3, Lassi Tuura3, Zongru Wan4, Francisco Yumiceva1 1Fermilab, 2DESY-HH, 3Northeastern Univ., 4Kansas State Univ. 2007 Computing in High Energy and Nuclear Physics Conference Online Computing Session OC-2, Id 221 September 5, 2007 Victoria, British Columbia, Canada
Introduction and Outline • CMS Online Web-Based Monitoring • Remote Operations • Justification • Physical installation, use of web services • Online Web Services • Database as source; need for meta-data descriptors • Browsing, plotting, & dynamic time correlation plots • CMS RunSummary example servlet • Screen Snapshot Service S3 desktop image display • Environmental trends over time & real time status • Web-Based Root browser; data quality monitoring • Demonstrate experience during data taking • Cosmic Ray runs, Global test runs • Conclusions
Where in the World is CMS? CMS Endcap lowering into collision hall 100m below Cessy, France Large Hadron Collider (LHC) √s=14TeV Detects proton-proton collisions
The Really Big CMS • 2/3 in collision hall • Services to central piece of barrel • Preparing for silicon tracker install • December Cosmics with Magnet • Summer 2008 collisions Silicon tracker goes here Electro-magnetic calorimeter Muon drift tubes Solenoid CMS Collision Hall 2007.08.30 “Compact” Muon Solenoid
The Really Big CMS World Don’t you remember the original purpose of the WorldWideWeb? The need to disseminate HEP data world-wide grows even more important with huge collaborations spanning the globe
Why Remote Operations? • Thousands of collaborators located all over the world • Most of them not resident at CERN • Collider H.E.P. has never before been so concentrated in one location • Need to disperse and disseminate • R.I.P. • HERA June 2007 • CESR 2008 • PEP II 2008 • Tevatron October 2009… • Future • ILC – 2020? 2120? Ever? • Are we the last HEP collider experiment? • Must be clever to survive “Leaving Cessy”
Remote Operations CMS Underground Control Room 2007.08.30 Global Integration Run Fermilab Remote Operations Center LHC@FNAL • Tools needed for remote status display • Must be easy to use, flexible, drillable • Coöperative with firewall, security • Must survive trans-Atlantic crossing • Also see Lucas Taylor’s talk, • “CMS Centers for Control, Monitoring, Offline Operations and Analysis” • Thursday, 14:00, DD-6, contribution 260 FNAL CERN
Web-Based Monitoring • Wealth of information in database • Trigger rates, event rates, cross sections, beam conditions, temperatures, voltages, environmental conditions, etc. … • Database is preferred locale for configuration and monitoring data persistency • Oracle 10 located at CMS site; replicated to offline world • Has current and historical status data • Latency ~ < 1 second to ~1 minute • Behind firewall for security reasons • Need a portal to gain access • Provide display of contents • And provide access control • Typical data present, “Value vs. Time” • Needs tools to access, plot, download, correlate • Complex, heterogeneous database • Many schemas, many designers • Already have 140 schemas just in the online database & not nearly done • Central description needed • Correlate across subsystems • Typical monitoring is “Value vs. Time” • Global meta-data descriptive tables
Meta Data Tables • Consider “value, time” pairs (x, tx) • Time: Timestamp, Run Number, Luminosity Subsection • Entries in meta-data tables specify value, time, units, type of data, subchannels, … • Allows general purpose retrieval from central tables • Conversion: HTML, Text, XML, Root formats • Root TTree n-tuple object with multiple values per time (x, y, z, t) • Optional caching of results • ?FORMAT=TEXT|XML|HTML|Root|GRAPHICS • Dynamic inline embedding of graphics • Other pages can access plots automatically • Available via HTML display page links or via direct download with curl or wget : • curl “http://cmsmon.cern.ch/cmsdb/servlet/GenericQuery?...”
DatabaseBrowser and GenericQuery • Peruse database definitions • Dynamic query definition • Data download, plots • DatabaseBrowser and GenericQuery Java/Tomcat servlets are focal point and parents of tools • Primarily expert starting point • General user pages inherit (Java) from browser • Specific use cases, easier to use
RunSummary query RunSummary query page an example of these monitoring and browsing tools • Select by: • Run range • Time range • Component status • Run duration, event • Trigger type • … more to come
RunSummary pages • Clickable measurements • Drill-down capability • Plot creation • Provides Root TTree and histogram object in file • Resizeable on resubmit
Time Correlation Plots ntuple x Must choose independent variable as basis for correlation tx ntuple w tw ntuple tx ty x y (x, tx) × (y, ty) ntuple ty y collate sort and pair nearest neighbors by time TTreeIndex plot w = x, y tw = tx, ty TH2D y ΔTx = ΔTy Time range must be identical: Δtx ~ Δty Time sampling period similar: x Heterogeneous environment, with no a priori correlation necessary
Time Correlation Example Example from MTCC* data magnet current vs. temperature • Browse hundreds of environmental and experimental data samples • Dynamically produce plot • Download Root, XML, text, HTML • OR construct your own URL for in-line linking or non-interactive “wget” access *Magnet Test Cosmic Challenge, November 2006
Trend over Time Plots • Search for performance anomalies • Interactive, historical, downloadable • Selection of type of data • Zoom in on problems EM Calorimeter (ECAL) Test Beam
Environmental – Slow Control • Access to current “right-now” conditions • …and historical settings and trends… Silicon Tracker Integration Facility Cosmic Ray Runs (Zongrun Wan) http://cmsmon.cern.ch/cmsdb/servlet/DcsLastValue
RootBrowser • Need light-weight method to browse plethora of Root output – e.g. data quality monitoring (DQM) • Some DQM > 100,000 histograms CSC (!) • Display Root Folder tree dynamically • Selective display of objects implementing the Draw() method • Implement browser for Root files • Latency ~ 30 seconds to 5 minutes • Transfer minimal data needed for display • Dynamic TFolder opening and dynamic TObject display • Optional single object download • No dependency on data structure of Root objects • No special web client software needed • Javascript on display (client) side, Java/Tomcat plus Root on server • A la Ajax • Also developing sophisticated detector-specific display • User-defined markups and arrangement, with tools • Network protocol data transfer – latency < 1 s • Lassi Tuura
DQM / RootBrowser Dynamic JavaScript displays with Tomcat/Java backend Silicon Tracker Integration Facility Cosmic Ray Run Hadron Calorimeter (HCAL) Global Integration / Cosmic Ray Run New DQM GUI with user markup (Lassi Tuura)
Screen Snapshot Service S3 • Remote Operations need Remote Knowledge • Operations screens, e.g. RunControl, HV Control, EventDisplay valuable for remote users to know what is going on • But normally have tight restrictions on access to nodes • What is the Screen Snapshot Service? • A way to provide periodic, read-only copies of display images (snapshots) for remote viewing • Similar to products like VNC, pcAnywhere, and VGA2WEB but without the cost or danger of accidental remote control • Can be used to make private-network displays viewable on the public internet (useful for remote monitoring) • Uses commonly available technologies for portability and ease of use: Java, JSP, Tomcat (Kurt Biery)
Screen Snapshot Service Mechanism Provides real time images of monitor displays to remote sites Web Client 1 Remote Ops Snapshot Producer 1 Java web start app Web Client 2 . . . . . . Snapshot Producer n Web Service Disk Cache Web Client m Periodic HTTP Web POST with image payload Normal HTTP Request Web page, no special config Private net Firewall Public net control widget (Kurt Biery)
Screen Snapshot Service Example CMS EventDisplay Actual snapshots from 2007.08.30 CMS global integration run (Ianna Osborne) S3 CMS RunControl (see Alex Oh, CHEP’07 279)
More Run Monitor Tools CMS “Page 1” top level status display, simplicity for even the most naïve user (Oracle Portal) (S.Murray) CMS Fermilab Data File Process Summary Page Files copied to FNAL Tier 1 site and status of processing (jsp) (F.Yumiceva, D.Mason)
Conclusions • LHC plans first collisions in 2008 • Remote Operation will be an important part of CMS data taking • Tools have been developed for remote operations • Actively used in Cosmic Runs, Test Beam, Global Integration Runs, late 2006 through 2007 • Remote Operations Center or Individual Users and Experts • Continued development in preparation for collisions • Accessible at http://cmsmon.cern.ch
More Backup Slides
HomePage • cmsmon home page • http://cmsmon.cern.ch • Links to servlets and documentation • Visit me
cmsmon Activity cmsmon.cern.ch server access rates >36,000 hits July 2007 …before experiment has begun
Example URL Plot Query <IMG SRC= http://cmsmon.cern.ch/cmsdb/servlet/GenericQuery ?DB=omds &OWNER=DCS_ENVIRONMENT &TABLE=FWMAGNETCMS &SELECT_MAGNET_CURRENT=1 &PLOT_MAGNET_CURRENT=1 &NOTNULL_MAGNET_CURRENT=1 &SELECT_CHANGE_DATE=1 &TIME_CHANGE_DATE=1 &PLOT_CHANGE_DATE=1 &LOW_CHANGE_DATE=2006.11.01_13:40:40 &HIGH_CHANGE_DATE=2006.11.02_13:40:40 &MIN_CHANGE_DATE=2006.11.01_13:40:40 &MAX_CHANGE_DATE=2006.11.02_13:40:40 &FORMAT=GRAPHICS> Location of Data in DB Which columns to plot, which column is time Time and plot ranges or LAST_CHANGE_DATE=seconds Payload returned will be purely PNG graphics
Example Multiple Time Plot Plotting current, temperature and magnet current from November 2006Downloadable Root file contains composite TTree ntuple for all three