Download
1 / 20
200 likes | 224 Views
Drought, a major outcome of global warming, poses significant economic and environmental threats globally. This study explores drought patterns in Çamlıdere Basin through the Standardized Precipitation Index (SPI). With data spanning from 1926 to 2008, different SPI time scales are utilized to assess drought severity and trends over time. Results suggest a notable increase in SPI values over certain periods, indicating a shift in drought patterns within the basin. The findings also highlight the impact on river flow and groundwater resources.

E N D
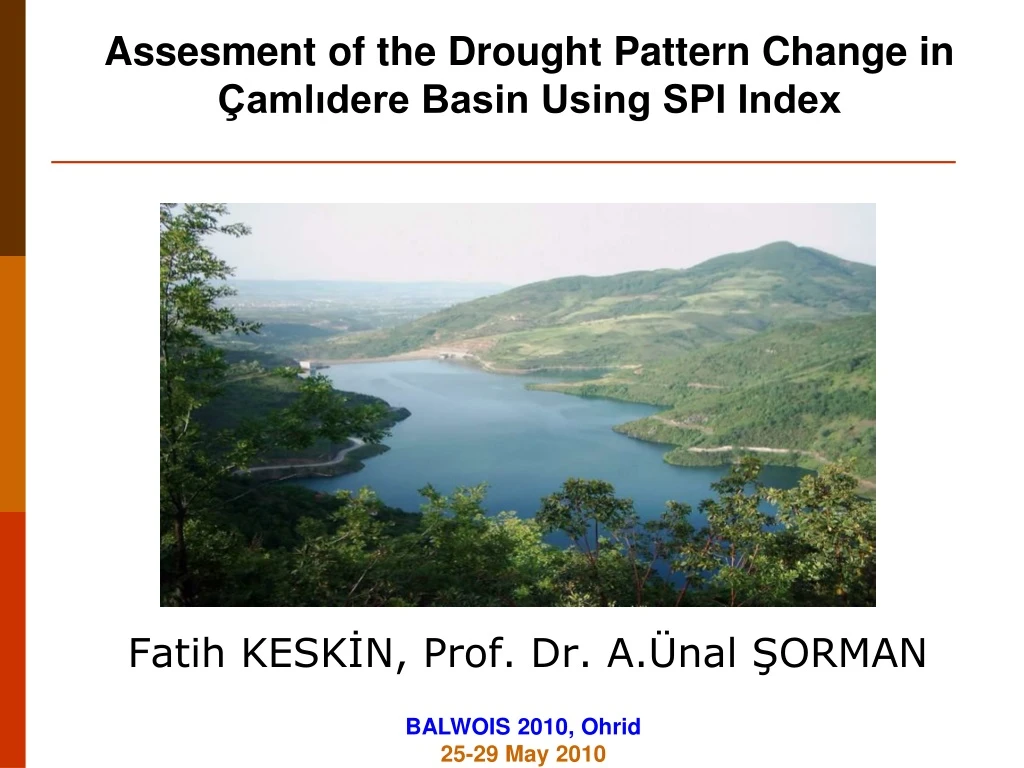
Assesment of the Drought Pattern Change in Çamlıdere Basin Using SPI Index Fatih KESKİN, Prof. Dr. A.Ünal ŞORMAN
Outline • Introduction • Data & Methodology • Analysis • SPI index • Discussion • Conclusion
Introduction • Drought which is one of the main results of global warming is the world most costly and collectively affecting natural disasters that cause an average $6-8 billion in global damages yearly. • Agricultural crop damage is expected to be same figures around in Turkey because of drought events which took place in 2007.
Introduction Drought can be examined in three different types - less than normal amount of precipitation : meteorological drought- Agricultural droughts - Hydrological droughts The term hydrological drought is applied to less than normal amounts of water in the different types of water bodies, represented by low water levels in streams, reservoirs and lakes as well as a low groundwater level.
Study Area Camlidere Dam Purpose : Domestic water supply (800.000 m3/day) Constructed in 1985. Height : 105 meters Storage capacity : 1226 hm3 Supplied water : 150 hm3/year Drainage area : 751 km2 Average Elevation of the basin : 1381 meters The change in elevation for the basin is between 920-2400 meters High amount of snow accumulation is observed after 1800 meters.
Data Study period : 1926-2008 Monthly records of precipitation is used in the study. The precipitation data were recorded by the State Meteorological Service (DMI) in Ankara, Esenboğa and Kizilcahamam stations and the station operated by the Ministry of Agriculture and Rural Affairs (MARA) in Guvenc basin.
Methodology • The analysis of precipitation is applied by normalization of precipitation data with gamma distribution. At the end, Standardized Precipitation Index (SPI) values are found. • The period is divided into two periods as • 1926-1966 and 1967-2008 • The difference between these periods in terms of SPI is examined in order to observe any drought pattern change in the basin.
SPI index • Precipitation data can be expressed with Gamma or Log Normal 3 distributions. • SPI is calculated by selecting a set of averaging periods to determine a set of time scales of period j months where j is 3, 6,12,24,48 months. • The dataset formed in a moving sense that a new series is formed from the previous j months. • These dataset are fitted to gamma function to get the probability of precipitation for the recorded data. • The probability of a precipitation value is determined with an estimate of the inverse normal for calculating the precipitation for a normally distributed probability density with a mean of zero and standard deviation of unity
The frequencies for the first and second period for dry conditions are tabulated by using the drought categories of Mc Kee et. Al. (1993). According to this table, the number of drought events is increasing.
The condition of drought pattern is also examined by looking the return period for two periods with the available data. • The SPI values less than zero are separated from the original data and used for kolmogorov-simirnov test for the calculation of drought severity for 2, 5, 10, 25, 50, 100, 200 and 500 years. • The test has been carried for %95 confidence level for significance level. • Gamma, Log Normal 2, Normal, Gumbel, Log Pearson Type II and Type III distribution functions are tested for the selected data and after the analysis the best fitted distribution function is used calculation of the drought severity.
CONCLUSION • The results showed that there is %20 increase in the second period of 24 month SPI and % 35 increase for 12 month SPI, whereas 10% increase in short term SPI is examined. • Moreover, there is no difference for the 6 and 9 months SPI. • The difference between two periods showed that there is a change in the pattern of droughts in Çamlıdere dam basin. • The results also proves the change of drought pattern in the basin with also supporting that mostly the change is on river flow and groundwater with in the basin.
Thank You E-mail: fatihk@dsi.gov.tr