Download
1 / 40
400 likes | 416 Views
Explore the average charges, budgets, and inflation-adjusted prices in higher education from 1989 to 2020. Analyze tuition and fees, room and board costs, state funding, and more. Stay informed on college pricing trends.

E N D
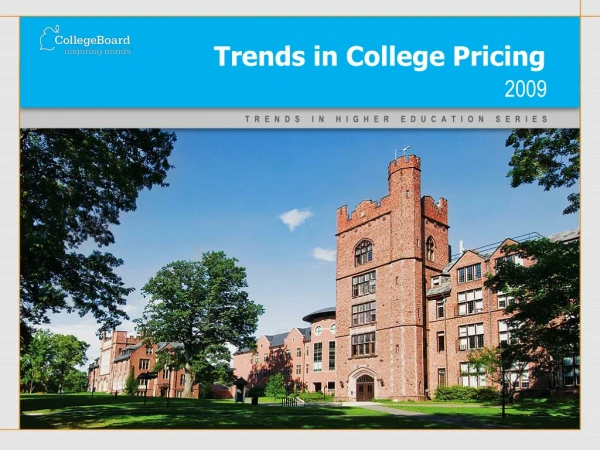
Trends inCollege Pricing 2019 November 2019 research.collegeboard.org/trends Trends in Higher Education Series
Average Published Charges (Enrollment-Weighted) for Full-Time Undergraduates, 2018-19 and 2019-20 Source: The College Board, Trends in College Pricing 2019, Table 1.
Average Estimated Full-Time Undergraduate Budgets (Enrollment-Weighted) by Sector, 2019-20 Source: The College Board, Trends in College Pricing 2019, Figure 1.
Distribution of Full-Time Undergraduates at Four-Year Institutions by Published Tuition and Fees, 2019-20 Source: The College Board, Trends in College Pricing 2019, Figure 2.
Average Published Tuition and Fees in 2019 Dollars by Sector, 1989-90 to 2019-20 Source: The College Board, Trends in College Pricing 2019, Figure 3.
Average Tuition and Fees and Room and Board in 2019 Dollars, 1989-90 to 2019-20, Selected Years Source: The College Board, Trends in College Pricing 2019, Table 2.
Average Annual Percentage Increase in Inflation-Adjusted Published Prices by Decade, 1989-90 to 2019-20 Source: The College Board, Trends in College Pricing 2019, Figure 4A.
Inflation-Adjusted Published Tuition and Fees Relative to 1989-90, 1989-90 to 2019-20 (1989-90 = 1.0) Source: The College Board, Trends in College Pricing 2019, Figure 4B.
Average 2019-20 In-District Tuition and Fees at Public Two-Year Institutions and Five-Year Percentage Changes in Inflation-Adjusted In-District Tuition and Fees, by State Source: The College Board, Trends in College Pricing 2019, Figure 5.
Average 2019-20 Tuition and Fees at Public Four-Year Institutions and Five-Year Percentage Changes in Inflation-Adjusted In-State Tuition and Fees, by State Source: The College Board, Trends in College Pricing 2019, Figure 6.
2019-20 Tuition and Fees at Flagship Universities and Five-Year Percentage Changes in Inflation-Adjusted In-State Tuition and Fees Source: The College Board, Trends in College Pricing 2019, Figure 7.
Average Published and Net Prices in 2019 Dollars, Full-Time In-District Undergraduate Students at Public Two-Year Institutions, 1999-00 to 2019-20 Source: The College Board, Trends in College Pricing 2019, Figure 8.
Average Published and Net Prices in 2019 Dollars, Full-Time In-State Undergraduate Students at Public Four-Year Institutions, 1999-00 to 2019-20 Source: The College Board, Trends in College Pricing 2019, Figure 9.
Average Published and Net Prices in 2019 Dollars, Full-Time Undergraduate Students at Private Nonprofit Four-Year Institutions, 1999-00 to 2019-20 Source: The College Board, Trends in College Pricing 2019, Figure 10.
Average Net Tuition and Fees, Net Other Expenses, and Grant Aid in 2015 Dollars by Income and Dependency Status, 2003-04, 2007-08, 2011-12 and 2015-16 Source: The College Board, Trends in College Pricing 2019, Figure 11.
Average Net Tuition and Fees, Net Other Expenses, and Grant Aid in 2015 Dollars by Income and Dependency Status, 2003-04, 2007-08, 2011-12 and 2015-16 Source: The College Board, Trends in College Pricing 2019, Figure 11.
Average Net Tuition and Fees, Net Other Expenses, and Grant Aid in 2015 Dollars by Income and Dependency Status, 2003-04, 2007-08, 2011-12 and 2015-16 Source: The College Board, Trends in College Pricing 2019, Figure 12.
Average Net Tuition and Fees, Net Other Expenses, and Grant Aid in 2015 Dollars by Income and Dependency Status, 2003-04, 2007-08, 2011-12 and 2015-16 Source: The College Board, Trends in College Pricing 2019, Figure 12.
Time Elapsed Between First Postsecondary Enrollment and Completion of Bachelor’s Degree, 2015-16 Bachelor’s Degree Recipients Source: The College Board, Trends in College Pricing 2019, Figure 13.
Living Arrangements of Full-Time Undergraduate Students Taking Courses in Classroom Settings, 2015-16 Source: The College Board, Trends in College Pricing 2019, Figure 14.
Annual Percentage Change in Inflation-Adjusted Per-Student State and Local Funding for Higher Education and in Tuition and Fees at Public Institutions, 1987-88 to 2017-18 Source: The College Board, Trends in College Pricing 2019, Figure 15A.
Total and Per-Student State and Local Funding for Higher Education in 2017 Dollars and Public FTE Enrollment, 1987-88 to 2017-18 Source: The College Board, Trends in College Pricing 2019, Figure 15B.
2017-18 State and Local Funding for Higher Education per Student and per $1,000 in Personal Income and 10-Year Percentage Change in Inflation-Adjusted Funding per Student, by State Source: The College Board, Trends in College Pricing 2019, Figure 16.
Institutional Revenues per Full-Time Equivalent (FTE) Student in 2016 Dollars at Public Institutions, 2001-02, 2006-07, 2011-12, and 2016-17 Source: The College Board, Trends in College Pricing 2019, Figure 17.
Percentage of Institutional Revenues from Various Sources Source: The College Board, Trends in College Pricing 2019, Page 26.
Net Tuition Revenues, Subsidies, and Education and Related Expenditures per Full-Time Equivalent (FTE) Student in 2016 Dollars, 2001-02, 2006-07, 2011-12, and 2016-17 Source: The College Board, Trends in College Pricing 2019, Figure 18.
Net Tuition Revenues, Subsidies, and Education and Related Expenditures per Full-Time Equivalent (FTE) Student in 2016 Dollars, 2001-02, 2006-07, 2011-12, and 2016-17 Source: The College Board, Trends in College Pricing 2019, Figure 18.
Subsidy as a Percentage of Education and Related Expenditures Source: The College Board, Trends in College Pricing 2019, Page 27.
Endowment Assets per Full-Time Equivalent (FTE) Student at Four-Year Colleges and Universities by Decile, 2016-17 Source: The College Board, Trends in College Pricing 2019, Figure 19.
Endowment Assets per Full-Time Equivalent (FTE) Student at Four-Year Colleges and Universities by Decile, 2016-17 Source: The College Board, Trends in College Pricing 2019, Figure 19.
Percentage Change in Inflation-Adjusted Mean Family Income by Quintile, 1988 to 1998, 1998 to 2008, and 2008 to 2018 Source: The College Board, Trends in College Pricing 2019, Figure 20A.
Median Family Income by Selected Characteristics, 2018 Source: The College Board, Trends in College Pricing 2019, Figure 20B.
Postsecondary Fall Enrollment by Attendance Status and Level of Enrollment (with Percentage of All Students Enrolled in Each Sector), 2000 to 2017, Selected Years Source: The College Board, Trends in College Pricing 2019, Figure 21.
Percentage Change in Full-Time Equivalent (FTE) Enrollment in Public Institutions by State, Fall 2007 to Fall 2017 Source: The College Board, Trends in College Pricing 2019, Figure 22A.
Percentage of All Public Full-Time Equivalent (FTE) Undergraduate Enrollment in Two-Year Institutions by State, Fall 2017 Source: The College Board, Trends in College Pricing 2019, Figure 22B.
Distribution of Undergraduate Enrollment by Sector Within Race/Ethnicity Groups, Fall 2017 Source: The College Board, Trends in College Pricing 2019, Figure 23A.
Distribution of Undergraduate Enrollment by Race/Ethnicity Within Sectors, Fall 2017 Source: The College Board, Trends in College Pricing 2019, Figure 23B.
Share of Faculty in Degree-Granting Postsecondary Institutions Employed Full Time, Fall 1993 to Fall 2017, Selected Years Source: The College Board, Trends in College Pricing 2019, Figure 24A.
Female Share of Faculty in Degree-Granting Postsecondary Institutions, Fall 1993 to Fall 2017, Selected Years Source: The College Board, Trends in College Pricing 2019, Figure 24B.
ThankYou. research.collegeboard.org/trends trends@collegeboard.org sandybaum73@gmail.com