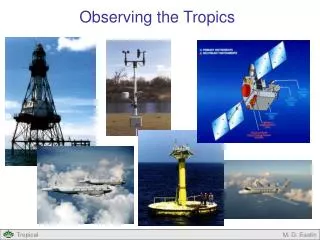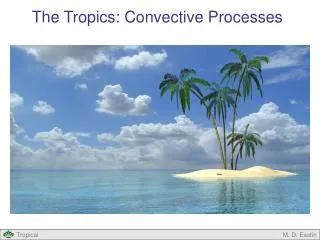
Observing the Tropics
300 likes | 336 Views
Explore how buoys & satellites help monitor and predict tropical cyclones. Learn about drogue drifters, reconnaissance flights, QuikSCAT, TRMM mission, and more.

Observing the Tropics
E N D
Presentation Transcript
Observing the Tropics C.C. Hennon, UNC Asheville
Buoys • Two types • Drifter • Attached to sub-surface anchor (“drogue”) 15 meters below surface • Drogue can measure mixed layer currents • Floats freely on water surface • Average lifespan is 400 days • Weigh between 44 and 100 lbs. • Data transmitted to passing satellites • ARGOS C.C. Hennon, UNC Asheville
Surface Float Drogue http://www.aoml.noaa.gov/phod/dac/gdp_drifter.html C.C. Hennon, UNC Asheville
http://www.aoml.noaa.gov/phod/graphics/dacdata/globpop.gif C.C. Hennon, UNC Asheville
Buoys • Two types • Moored • Anchored to sea floor • Generally located near coastlines • Provide important information for landfalling TCs • Data collected and monitored by National Data Buoy Center (NDBC) C.C. Hennon, UNC Asheville
Buoy regions controlled by the National Data Buoy Center C.C. Hennon, UNC Asheville
TAO Array – Detection and observation of ENSO events - Consists of 70 buoys C.C. Hennon, UNC Asheville
http://www.oc.nps.navy.mil/webmodules/ENSO/TAO.html C.C. Hennon, UNC Asheville
Hurricane Katrina Passage over moored buoy GDIL1 C.C. Hennon, UNC Asheville
Katrina just 65 miles to the west (145 mph) Significant wave height = 16.9 m (55.5 ft) Maximum wave height (statistically derived) = 32.1 m (109 ft)!! SWH = Average of highest 1/3 of waves C.C. Hennon, UNC Asheville
Reconnaissance Flights • Aircraft penetrations of TCs • Performed since 1944 • GPS Dropsonde most critical instrument • measures temperature, humidity, pressure, winds • data available in near-real time at National Hurricane Center C.C. Hennon, UNC Asheville
http://www.gsfc.nasa.gov/gsfc/earth/pictures/camex4/dropsonde.gifhttp://www.gsfc.nasa.gov/gsfc/earth/pictures/camex4/dropsonde.gif C.C. Hennon, UNC Asheville
“Hurricane Hunters” • 53rd Weather Reconnaissance Squadron • Keesler AFB, Biloxi MS • 10 C-130 planes C.C. Hennon, UNC Asheville
Tropical Rainfall Measurement Mission (TRMM) • First space-borne precipitation radar • Measures precipitation between 35°N and 35°S • Used for a lot of purposes • surface soil moisture • lightning research • detection of Madden-Julian Oscillation • improving SST datasets C.C. Hennon, UNC Asheville
Tropical Rainfall Measurement Mission (TRMM) • “Active” sensors • Precipitation Radar (PR) • “Passive” sensors • TRMM Microwave Imager (TMI) http://www.atmos.washington.edu/~houze/RAHouzeWebsite/houze_files/trmmsat.gif C.C. Hennon, UNC Asheville
TRMM and Tropical Cyclones • TMI used to identify circulation centers that may be obscured in IR imagery • PR provides information about rain rate C.C. Hennon, UNC Asheville
TRMM pass over Tropical Cyclone Manou. The inner swath (PR) shows rainfall rates (red = highest); the outer swath (TMI) detects rainbands, and can also be used to detect circulation centers. TMI pass near landfall of the 2004 Brazilian hurricane. Red areas represent strong convection. The center of the circulation is noted with an arrow. C.C. Hennon, UNC Asheville
QuikSCAT • Scatterometer • Emits pulse of radiation (13.4 GhZ) toward ocean surface • Capillary waves (1 cm) on ocean surface backscatter pulse • More roughness = higher surface wind speeds • Wind direction can be determined by varying the azimuthal “look angle” • Observe same spot from at least 4 angles C.C. Hennon, UNC Asheville
QuikSCAT Operation 803km 46 deg 53 deg 900km C.C. Hennon, UNC Asheville
Uses of QuikSCAT • Able to retrieve high resolution (25 or 12.5 km) 10-meter wind speed and direction • Cross swath width of 1800 km • 90% global coverage daily • Accurate within 2 m/s for wind speeds of 2-20 m/s (~4 - 40 kt) • Data are assimilated in global weather models and have made them more accurate • Have helped TC forecasters identify tropical depressions and maximum extent of wind • Identify ITCZ and other tropical wind features C.C. Hennon, UNC Asheville
TD-14 (2003). QuikSCAT resolves circulation center that is not apparent via any other means. C.C. Hennon, UNC Asheville
Limitations of QuikSCAT • Unrealistic wind directions for TCs and other rainy areas • Egregious wind speed errors in rainy regions • Areas of ocean missed in between swaths C.C. Hennon, UNC Asheville
Rain Impacts on QuikSCAT Data • Rain contaminates the QuikSCAT data: • Attenuates beam (lowers retrieved wind speed) • Increases backscatter of the beam (raises retrieved wind speed) • Splash drops on surface enhance backscatter (raises retrieved wind speed) • What’s more important? • Depends on rain rate and true surface wind speed C.C. Hennon, UNC Asheville
QuikSCAT surface winds Hurricane Isabel (2003) NHC Winds = 140 kt. MSLP = 932 mb C.C. Hennon, UNC Asheville
Advanced Microwave Sounding Unit (AMSU) • Passive Radiometer • Onboard polar orbiting NOAA satellites • Senses microwave radiation • Can determine atmospheric temperatures for many layers • 15 different channel sensors • Soundings • Used to diagnose warm cores in TCs and TC intensity C.C. Hennon, UNC Asheville