Download
1 / 13
130 likes | 142 Views
This analysis explores the debt relief and gains to creditors during the 1997 Korean Crisis, specifically focusing on the impact of capital inflows, reversal of flows, and the Brady Bonds Deal.

E N D
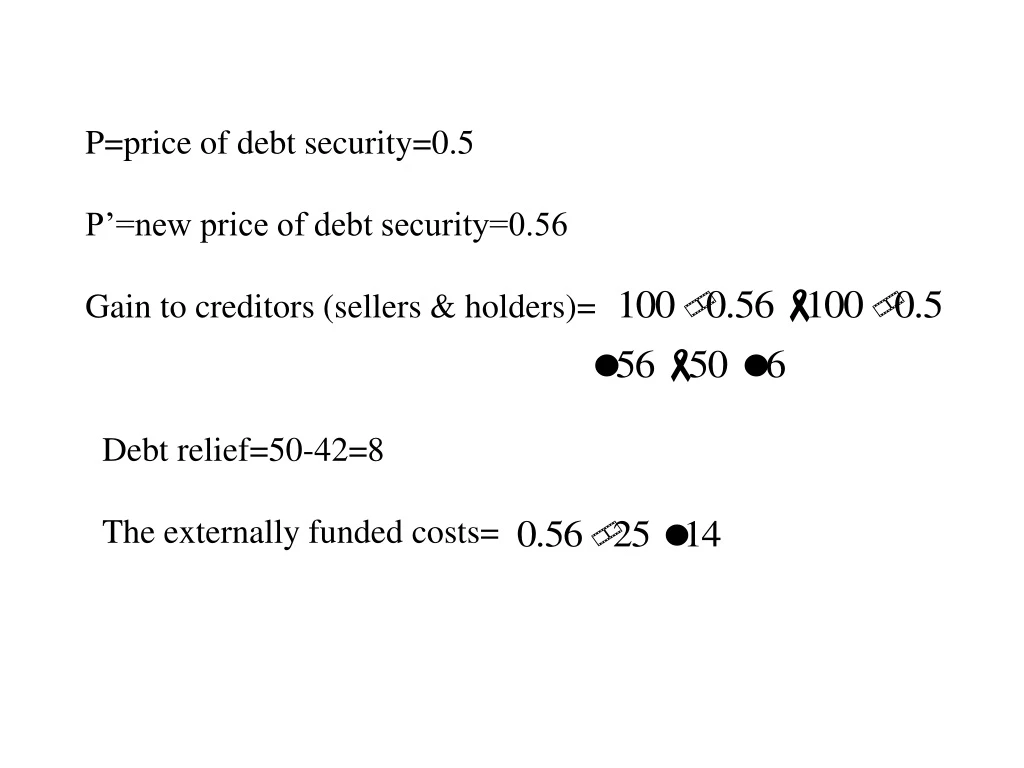
P=price of debt security=0.5 P’=new price of debt security=0.56 Gain to creditors (sellers & holders)= Debt relief=50-42=8 The externally funded costs=
Gain to sellers Gain to holdout creditors Total gain to creditors
Emerging Markets 1997 Korean Crisis (1997): Liberalization of capital account was associated with $120 billions of capital inflows, 1992-1997. Reversals of flows in second half of 1997 thru 1998 generated a downturn in the economy and debt problem but this time mostly to private sector and financial intermediaries- although there was a substantial Intl bail out.
Brady Bonds Deal • A country issues new bonds (Brady Bonds) with a reduced rate of interest, and with Industrial Country Coovts guarantees. Thus the market will purchase these bonds since they are credit worthy. • Resources obtained from the Brady Bonds’ issue will be used to buy back the country old debt. (on which the country was not credit worthy) Thus, the real amount to a combination of external funding (not thru grants but through good credit) that finances a buy back of old debt.
Price 1 New price 0.56 Old price AV 0.5 MV Nominal debt 25 75 100
Knocked DownSecondary-market debt prices,September, 1991, % of face value
International Cross-Section Regression P=price D=Nominal Debt X=Exports G=Growth rate
Debt Reduction and Expected Repayments: Effect on probabilities. D=face value V=pD+(1-p)d Marginal change in probability of good state when face value increases by 1 unit <0 • Thus the debt reduction raises AV for 2 reasons: • Relative payments d/D, rise • P rises.
AV= Average of debt =0.5 (price) MV=Marginal value of debt=0.33 (1/3) MV<AV Mv is the change in the market value of debt (=Expected repayment to creditors) if the NOMINAL debt is increased by 1 unit.
PD=V Debt relief Laffer Curve D* D 1 P* AV D D* MV