Download
1 / 34
340 likes | 340 Views
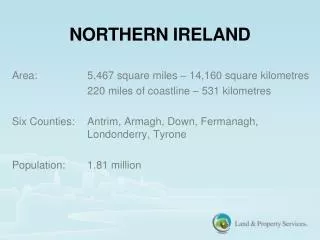
Household Projections for Northern Ireland 9 th September 2009. Dr David Marshall & Dr Jos IJpelaar Demography & Methodology Branch Northern Ireland Statistics & Research Agency. Introduction. 2006-based Household projections Health Card Registration Data Persons/household information

E N D
Household Projections for Northern Ireland9th September 2009 Dr David Marshall & Dr Jos IJpelaar Demography & Methodology Branch Northern Ireland Statistics & Research Agency
Introduction • 2006-based Household projections • Health Card Registration Data • Persons/household information • Use for household propensities • Use for household transition indicators • Implementation in 2008-based projections
2006-Based Household Projections
NI Household Projections • Housing Growth Planning • Household composition trend 1991-2001 Census • First published in January 2005 • Updated using 2006-based population projections; in March 2008
Schematic Projection Process Fertility, mortality and migration assumptions Mid-Year Population Estimates Household Projections Population Projections 2001 Census Household formation assumptions 1991 Census Other Sources
Household Membership Probabilities • 18 Household categories • seven sizes (1 - 7+ persons) and three types (adults only, 1 adult with children, 2+ adults with children) • 14 Age groups • Projected probabilities for membership of each household category for each age-sex group • Constant age-sex probability of being resident in communal
Methodology: 2-Point Exponential For p2001 < p1991 For p2001 >= p1991
Some special cases Constant probabilities for under 19s Evidence that the 1991-2001 trend of smaller families and more single parent households does not continue in the period 2001-06 Complete “households with children” with adults, remaining adults distributed over childless household types Complete couple households with females aged 75+ from single households
Subtract projected communal population
Children in households with children
Complete households- with-children with adults
Allocate remaining adults over childless households
Completing elderly couple households
Health Card Registration Data
NI Health Card Data • 1.817M health records (2008) • 1.775M population estimate (2008) • Primary source for official migration estimates • Date of Birth, Sex & Address
Health Card (2001) vs. Census Household population by age and sex
NI Health Card Data • Using address database to allocate unique address identifier • Household definition: all persons at same address • Communal establishments: exclude all addresses with 15+ persons
NI Health Card Data - Issues • Accuracy depends on notification • Incomplete address information • Persons not families • Armed Forces • List Inflation
2001 Census Households with children, Females
Health Card (2001) vs. Census Households with children, Females
Health Card Data, 2001-2008 Females in 2 adult households (without children)
Household Transition • Age-sex probability of persons in household type A in year t being in household type A,B,C… in year t+1 • Does not take account of other persons in household • Cannot be done using Census data
Household Transitions Example:Household type in 2008 for females who were aged 25-29 in childless 2-adult households in 2007
Household Transitions Example (2)Females aged 25-29yrs, 2007-8 (excl. migration)
Household Transitions Example (3)Females 25-29yrs, projections with transition matrix
Household Type - MigrationFemales aged 25-29yrs, 2007 and 2008
Using Health Card Registration Data in 2008-based Household Projections
Census trend vs. Health Card data Males aged 4-15yrs, 1 adult & 1 child household
Census trend vs. Health Card data Males aged 4-15yrs, 1 adult & 1 child household
Census trend vs. Health Card data Males aged 4-15yrs, 1 adult & 1 child household
Further Developments 2008-based household projections will be published in Spring 2010 Health Card data for projecting propensities Review methodology Introduce cohort analysis with transition matrices Constrain transitions with projected births, deaths and migration Alternative household types? Explore use of alternative data sources Longitudinal Study?
Household Projections for Northern Ireland9th September 2009http://www.nisra.gov.uk/demography/default.asp21.htm Dr David Marshall & Dr Jos IJpelaar Demography & Methodology Branch Northern Ireland Statistics & Research Agency