Download
1 / 23
230 likes | 309 Views
The Power of Information. Making Analytics Strategic. Sept 23, 2008. Objectives. Share with you our real world experiences. Give you some concrete ideas how you can energize your organization and lead the way to profit growth. Content.

E N D
The Power of Information Making Analytics Strategic Sept 23, 2008
Objectives • Share with you our real world experiences. • Give you some concrete ideas how you can energize your organization and lead the way to profit growth
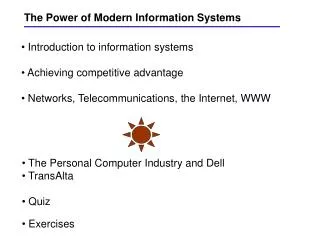
Content • The current business paradigm (my simplistic observations) • How information can be leveraged to drive change • Information Age business management • Incentives • Why Now? • Good reading
Business Models • Every $1 Billion business has at least one Balance Sheet item or P&L cost item which is $100’s of millions • These items are the core operational costs to execute the business model • In Finance and Insurance it is working capital plus losses • In Retail it is merchandising (COGS plus distribution) • In Telco it is network costs • In Manufacturing it is production cost (equipment, raw materials, logistics) • … • In some large businesses sales and marketing costs are also very large
Operational Efficiency • In the past dramatic improvements in profitability have been driven by new ways to execute the operational model • In each industry segment every company executes the same business model with approximately the same level of inefficiency • As one player finds some way to drive efficiency every other player follows or dies
The Strategic Role of Technology • Technology (hardware, software and applications) has been used to enable an operational process • E.g. a large bank, large telco or large retailer cannot exist without transaction processing systems • In each industry segment, all companies have a similar cost per transaction
Decision Making • Most organizations make decisions to upgrade or improve their operational processes once per decade • The processes are then “run into the ground” and when they break or are about to break the next version is created • The risk involved with these decisions is bundled into a short period of time once per decade
~10 years Risk of Operational Failure The risk not to act grows A new operational process (application) is put in place and the cycle repeats
The Current Paradigm - Summary • Operational process efficiency drives corporate profitability • Transaction Processing technology runs most critical operational processes • Within industry segments all companies have similar cost per transaction • Organizations are not proactive
The Information Age • Basic Assumptions • The transaction/event data every company collects about it core operational processes can be utilized to create information which will improve operational efficiency • A 1% improvement in operational efficiency will drive large bottom-line gains. I believe 20% to 50% is possible in every corporation.
How information can be used to improve operational efficiency? • Every event is not created equal • Some are more risky than others • Some are more valuable than others • Some are more likely to be fraudulent than others • Some are less costly than others • … • Can we find patterns to allow us to re-allocate resources? • At the transaction level, account level, customer level, household level … • At the transaction level, account level, location level, regional level …
What does average mean? If a statistician told you a river had an average depth of 3 ft and flow rate of 3 ft/s would you walk across it?
How to optimize a metric(Hopefully a leading one) Re-allocation of resource to high value events cause the average to go up Opportunity for Operational efficiency Average performance
The new paradigm • Use information to find opportunities to re-allocate cost • Test and Learn, constantly “tweak” your operational processes • This requires a proactive management approach like balanced scorecard • This lowers your overall risk of failure and smooths out the business cycles
process • Map out and understand the existing business processes and identify how information interacts with them • Define use cases for information • I.e. if the fraud indicator is above 0.8 investigate the claim • Change your processes to include your new use cases
organization • Identify the individuals responsible for executing the information based activities that are part of your business processes • Ensure these people have the required skills to review analytical output, assess it and make recommendations for action
A new business paradigm … test and learn …Become proactive. Find the patterns and re-allocate costs Test to see if it works. Analyze the “spin off” effects Adjust cost allocation
A New Risk Profile A constant lower level of risk of failure Constantly “tweak” your operational processes based on the best information you have at hand
IncentivesOutside of business • Set up incentives so that individuals might change their behaviour • Create a currency (loyalty points, tax breaks, cash etc.) that has zero total value. “Zero sum currency” • Examples: Futures markets. Futures contracts have a zero total value. Their existence reduces overall market risk. Some individuals take on the risk that others don’t want. (speculators vs. commodity producers) • If you want to lower a specific metric make the people who have a higher than average contribution pay the people who have a lower than average contribution • This will change behaviour and lower the average
Additional Benefits • If we assign a measurement based objective and create incentives to change it we create accountability and transparency. • Two key elements required for change
Why Now? Why Not!
Good reading • Competing on Analytics • Freakonomics • Super Crunchers • Conrad Black Letters in the National Post or Globe and Mail? A good one this past week about his views on the knowledge economy
makeplaingsaarenvirta@makeplain.com • We offer • Insurance • Pre-payment focused fraud detection solution appliance for insurance (group benefits dental, medical, drug and propert and casualty • Retail • appliance solutions for merchandise optimisation (price, inventory, markdown, size/pack) • Location analytics • CRM Analytics • Loyalty Program management consulting • Data Warehousing, Business Intelligence and Data Mining consulting services • Data Warehouse appliances • Full-life cycle development • Management Consulting