Download
1 / 100
1.01k likes | 1.14k Views
Centre for Bhutan Studies. The 2010 Gross National Happiness Index : Part III. The Centre for Bhutan Studies 2011. Centre for Bhutan Studies. Part III: Increasing Happiness GNH Index and Policy: concern for Unhappiness Insufficiencies by Dzongkhag Insufficiencies by region

E N D
Centre for Bhutan Studies The 2010 Gross National Happiness Index : Part III The Centre for Bhutan Studies 2011
Centre for Bhutan Studies Part III:Increasing Happiness • GNH Index and Policy: concern for Unhappiness • Insufficiencies by Dzongkhag • Insufficiencies by region • Insufficiencies by gender • Insufficiencies by age group • Insufficiencies by marital status • Insufficiencies by occupational group • Policy recommendations • Sustaining GNH
Centre for Bhutan Studies Part III:Increasing Happiness • GNH Index and Policy: concern for Unhappiness • Insufficiencies by Dzongkhag • Insufficiencies by region • Insufficiencies by gender • Insufficiencies by age group • Insufficiencies by marital status • Insufficiencies by occupational group • Policy recommendations • Sustaining GNH
Centre for Bhutan Studies GNH Index: Purpose The GNH Index is formulated to provide an incentive to Increase Happiness. Civil servants, business leaders, and citizens of Bhutan may ask, ‘how can I help to increase GNH?’ The GNH Index can help them answer this question in practicalways.
Centre for Bhutan Studies Increasing GNH “Our nation’s Vision can only be fulfilled if the scope of our dreams and aspirations are matched by the reality of our commitment to nurturing our future citizens.” HM JigmeKhesarNamgyelWangchuck, the 5th King of Bhutan
Centre for Bhutan Studies Increasing GNH To Increase happiness, we need to ask a new set of questions. We have to identify people who are not yet happy. And we have to ask, where do they lack sufficiency? What must more be done? This analysis is of direct relevance for policy.
Centre for Bhutan Studies National GNH Index: .743 using the happiness threshold of 66%
Centre for Bhutan Studies National headcount ratio: 59% of Bhutanese do not fulfil the threshold of being happy in 6 or more than 6 domains. According to the GNH Index, they are ‘not-yet-happy’.
Centre for Bhutan Studies Of course, happiness is deeply personal. Some of these people may regard themselves as fully flourishing. That is why we need to discuss GNH widely in Bhutan.
Centre for Bhutan Studies National Breadth (Lack of sufficiency): Of the Bhutanese who are unhappy, on average they have insufficiency in 43% of the domains (roughly equal to 4 domains)
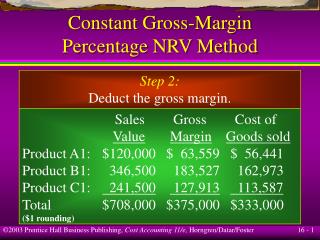
Centre for Bhutan Studies 3,76,975 1,66,124 Indicator: Psychological wellbeing, Health, Time use, Culture, Ecology, Community vitality, Good Governance and Living standards 1,46,956 Indicator: Health, Education and Living Standards Indicator: Consumption per capita .
Centre for Bhutan Studies First, a birds eye view of happy vs unhappy people. How do their achievements vary? When the blue bars are higher, it means that insufficiency is higher among unhappy people. For example, insufficiency in Life satisfaction is much higher among the unhappy.
Centre for Bhutan Studies Across all indicators we see that there is no indicator in which orange bars are higher than blue – none in which ‘happy’ people have less sufficiency than unhappy. But some are relatively close; others very different. Let’s look further.
Centre for Bhutan Studies Looking at psychological well-being, health, and time, we see that the ‘unhappy’ always have higher insufficiency. The groups are closest in sleep. Psychological Health Time Use well-being
Centre for Bhutan Studies Education Culture Governance In education, culture, and governance, the groups are least different in of Value, Language, DriglamNamzha, and Political participation. Both have highest deprivations in education.
In community, ecology, and living standard, the strong differences are in wildlife damage and in living standard. Happy people’s insufficiencies in community and ecology are otherwise rather close and in urbanization, almost equal. Centre for Bhutan Studies Community Ecology Living Standard
Centre for Bhutan Studies Next we analyse the blue bars – the insufficiencies of unhappy people – and ask, how can we reduce them?
Centre for Bhutan Studies Health is the lowest contributor to unhappiness followed by community vitality Education is the highest contributor to unhappiness
Centre for Bhutan Studies Contribution of Education indicators to unhappiness Percentage of people who are not-yet-happy and lack sufficiency
Centre for Bhutan Studies Contribution of Living standard indicators to unhappiness Percentage of people who are not-yet-happy and lack sufficiency
Centre for Bhutan Studies Contribution of Time use indicators to unhappiness Contribution of Good Governance indicators to unhappiness Percentage of people who are not-yet-happy and lack sufficiency
Centre for Bhutan Studies Cultural diversity and resilience indicators to unhappiness Psychological wellbeing indicators to unhappiness Percentage of people who are not-yet-happy and lack sufficiency
Centre for Bhutan Studies Community vitality indicators to unhappiness Ecological diversity and resilience indicators to unhappiness Percentage of people who are not-yet-happy and lack sufficiency
Centre for Bhutan Studies Contribution of Health indicators to unhappiness Percentage of people who are not-yet-happy and lack sufficiency
Centre for Bhutan Studies Ecological diversity and resilience Psychological wellbeing Cultural diversity and resilience Time use Living standards Health Education Community vitality Good Governance
Centre for Bhutan Studies More than 50% of the Bhutanese are insufficient in 3 of the 4 indicators of Education. Education Ecological diversity and resilience Psychological wellbeing Time use Cultural diversity and resilience Living standards Health Good Governance Community vitality
Centre for Bhutan Studies Schooling
Centre for Bhutan Studies Knowledge
Centre for Bhutan Studies Knowledge (contd.)
Centre for Bhutan Studies More than 40% of the Bhutanese are insufficient in 2 of the 4 indicators of Good Governance Education Ecological diversity and resilience Psychological wellbeing Time use Cultural diversity and resilience Living standards Health Good Governance Community vitality
Centre for Bhutan Studies Services
Centre for Bhutan Studies Political participation
Centre for Bhutan Studies Fundamental rights
Centre for Bhutan Studies Part III:Increasing Happiness • GNH Index and Policy: concern for Unhappiness • Insufficiencies by Dzongkhag • Insufficiencies by region • Insufficiencies by gender • Insufficiencies by age group • Insufficiencies by marital status • Insufficiencies by occupational group • Policy recommendations • Sustaining GNH
Centre for Bhutan Studies Percentage of not-yet-happy people by district Lower percentage of not-yet-happy people Higher percentage of not-yet-happy people
Percentage of Bhutanese who are not-yet-happy and lack sufficiency in indicators Cultural diversity and resilience Ecological diversity and resilience Living standards Psychological wellbeing Time use Education Good Governance Community vitality Health .
Centre for Bhutan Studies Where do the unhappy people live? Thimphu and Chukhaare home to the highest number of unhappy people…. Note Chukha and Thimphualso house the highest number of happy people! They are big dzongkhags.
Centre for Bhutan Studies Average insufficiencies amongst the not-yet-happy Those living in SamdrupJongkhar, Lhuentse, TashiYangste, and Trongsa experience insufficiency in the most indicators at the same time. Lower insufficiencies Higher insufficiencies
Centre for Bhutan Studies Part III:Increasing Happiness • GNH Index and Policy: concern for Unhappiness • Insufficiencies by Dzongkhag • Insufficiencies by region • Insufficiencies by gender • Insufficiencies by age group • Insufficiencies by marital status • Insufficiencies by occupational group • Policy recommendations • Sustaining GNH
In Rural areas, not-yet-happy people’s average ‘shortfall’ is about the same as urban shortfall. This is good news. It suggests less disparity in unhappiness by region. .
Urban Areas have highest insufficiency in Governance, Time use, and Culture. .
Rural Areas have highest insufficiency in Education and Living Standards. .