Download

1 / 19
220 likes | 674 Views
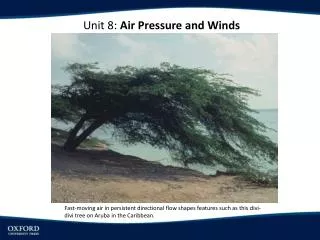
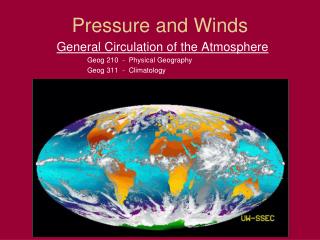
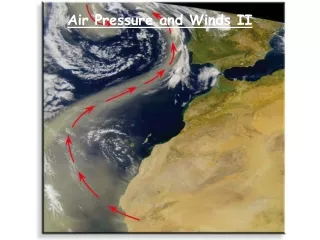
Air Pressure and Winds I. Review: precipitation types. Sample weather map (Fig. 13.11). Fig. 11.18. Snow. Drizzle. Sleet. Freezing rain. Fog. Atmospheric pressure P. Atmospheric pressure and density decrease with altitude exponentially!!!. Units: 1 bar=1000 mbar.

E N D
Fig. 11.18 Snow Drizzle Sleet Freezing rain Fog
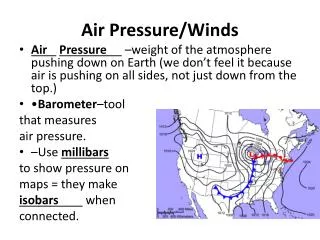
Atmospheric pressure P Atmospheric pressure and density decrease with altitude exponentially!!! Units: 1 bar=1000 mbar 1 Standard atmosphere: 1013 mbar
Ideal Gas Law • A relationship between the pressure, the temperature, and the density of an ideal gas. • Ideal gas: a simplified physical model for a gas. It neglects: • the volume of the individual molecules • the interaction between the molecules • The ideal gas model is a very good approximation for the air at room temperature.
Ideal Gas Law • The pressure P of an ideal gas is proportional to its temperature T and density r. C is a constant of proportionality – air gas constant. • Examples: • T increases, r constant -> P increases (tea kettle) • r increases, T constant -> P increases (blow a balloon) • T decreases, r decreases -> P decreases (climb a mountain) • P constant -> T increases, r decreases (example in the book: Fig. 8.2 (a) and (b))
Simple model of atmospheric pressure • Column of air molecules • Assumptions: • Constant density • Constant width • Atmospheric pressure P is simply due to the weight of the column. • P decreases with height because there are less molecules remaining above.
From high to low pressure • Equal surface pressures in cities 1 and 2 result from • Cold dense air in city 1 • Warm, less dense air in city 2 • At higher altitudes the pressures are different (L vs H) • The air flow (due to the pressure gradient force) is from High to Low -> expect to see the pressure dropping as the air temperature increases
How do we measure pressure? • Mercury (Hg) barometer. • The weight of the Hg column is balanced by the weight of the atmosphere above the open air surface. • 1 atmosphere = 76 cm.Hg = 29.92 in.Hg • Can we measure the atmospheric pressure with a water barometer?
Altitude Corrections • Pressure decreases with height. • Altitude adjustment: • Why: to compare pressure readings from stations at different altitudes. • Convert all P readings to the pressure at the Mean Sea Level: sea-level pressure. • For every 100 m add 10 mbar • This is a rough correction. • Sea-level pressure chart • Height surface: surface of constant height • Pressure maps on constant height surfaces show the horizontal variation of the pressure -> isobars
Sea-level pressure chart • Elements: isobars, high (H) and low (L) pressure regions • It is an example of a constant height chart (sea-level)
Pressure variations are plotted at a fixed altitude At higher altitudes, no need for altitude correction: what you measure is what you plot Typical values for the atmospheric pressure at various altitudes Sea-level: 1000 mb 3 km: 700 mb 5.6 km: 500 mb Constant height charts
Isobaric charts • Constant height chart: we fix the altitude and plot the pressure: the map shows lines of constant pressure (isobars). • Isobaric chart: we fix the pressure and plot the altitude where it is found: the map shows lines of constant height (contour lines). • High pressure <-> High height on the isobaric chart • Low pressure <-> Low height on the isobaric chart
The two types of pressure charts • Surface map (constant height chart) • Anticyclones (H) – centers of high pressure • Cyclones (L) – centers of low pressure • Upper-air chart (isobaric chart) • Pressure contour lines are parallel to the isotherms • Winds flow parallel to the pressure contour lines
Flying on a constant pressure surface • Airplanes measure altitude based on pressure readings • They move on constant pressure surfaces
High to Low, Look Out Below • This is a problem when T changes. The altimeter needs to be calibrated often with actual altitude measurements.