Download
1 / 13
130 likes | 464 Views
IEEE 802.11ax High Efficiency WLAN Packet measurements around Boulder, CO. Date: 2014-05-11. Authors:. Overview. 15 Students captured packets using NetworkMonitor + Wireshark – recorded time, data rate, packet size Sorted by data rate and packet size

E N D
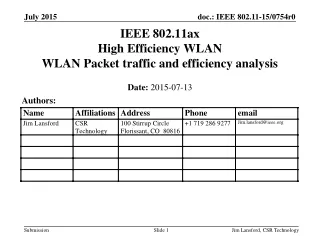
IEEE 802.11axHigh Efficiency WLANPacket measurements around Boulder, CO Date: 2014-05-11 Authors: Jim Lansford, CSR Technology
Overview • 15 Students captured packets using NetworkMonitor + Wireshark – recorded time, data rate, packet size • Sorted by data rate and packet size • Generated histograms of data rate vs packet size using at least 10,000 packets • On campus (Cisco managed network: controller+lightweight APs) • Apartment or dormitory • Pearl Street (heavy retail/commercial deployment) • Raw data available for other analysis • Detailed packet information (all header info): Each packet logged with elapsed time, data rate, size, SNR, MAC address, IP address, etc. • Freely available on public box.com folder as a zip file • Next steps – traffic model based on sum of sorted data models for traffic types Jim Lansford, CSR Technology
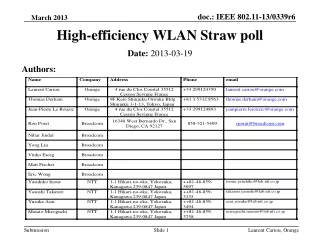
Assignment • Use Microsoft Network Monitor 3.4 to capture packets. • Save the captured data as .cap file and open the file through Wireshark. • Export the data from Wireshark and load it into an Excel spreadsheet • NOTE: The data date seems to get multiplied by two when importing into Excel!! • Using these data, draw a 2-D histogram of packet size vs data rate. • Capture the data and generate the 2-D histograms in three different locations: • Residential area (home, apartment, or dorm room) • On campus (in an office building if you are an off-campus student) • In a mall area, such as Pearl Street or the corner of 28th and Arapahoe in Boulder. Any mall or strip mall with numerous APs and STAs Jim Lansford, CSR Technology
Sample Wireshark trace (Pearl Street) Jim Lansford, CSR Technology
Pearl Street – heavy retail/commercial Data rate Jim Lansford, CSR Technology
Heavy retail/commercial Data rate Jim Lansford, CSR Technology
On CU-Boulder campus (managed network) Jim Lansford, CSR Technology
Managed enterprise network Jim Lansford, CSR Technology
Residential neighborhood (apartments) Data rate Jim Lansford, CSR Technology
Residential neighborhood (apartments) Data rate Jim Lansford, CSR Technology
Future work Generator 1 Generator 2 • Use packet traffic to build models • Packet generator for different data rates • Beacons at 1 or 6Mbps: small, periodic packets • Video at max rate: large, periodic packets • Need to look more closely at distribution of arrivals (not Poisson!) • Packet traffic model can be used to evaluate 11ax proposals S Generator 3 Generator N Jim Lansford, CSR Technology
Acknowledgements & Raw data availability • Several students volunteered to make their raw data available to anyone for additional analysis • Box: https://app.box.com/s/zc5sqgccg5aba58y5ur5 Data contributed by: • SagarSidhpura Sagar.Sidhpura@Colorado.EDU • Nadia YozaMitsuishi Nadia.YozaMitsuishi@Colorado.EDU • SwethaNatham Swetha.Natham@Colorado.EDU • Jay Rao Jay.Rao@Colorado.EDU Special thanks to Prof. Doug Sicker and: Jim Lansford, CSR Technology
Summary • Mostly what you would expect: • Heavily congested areas have mostly low rates and small packets • Lots of big packets in residential (video?) • Some residential environments were more congested than others • Some surprises • Lots of small, low rate packets (beacons?) in a managed environment • A great deal more analysis could be done • Raw files allow more detailed analysis • Could be used to develop better packet traffic models • Raw data freely available without restriction • Anyone is welcome to do more analysis or traffic modeling Jim Lansford, CSR Technology