Download
1 / 19
190 likes | 201 Views
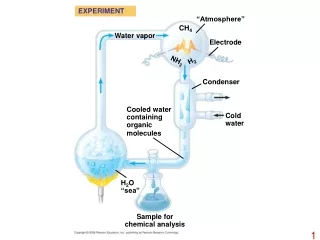
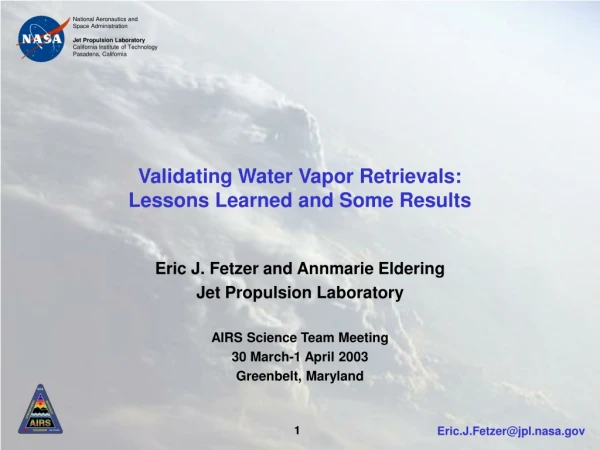
This presentation discusses the lessons learned and results from validating water vapor retrievals, focusing on the distribution of water vapor associated with temperature inversions in the subtropical eastern Pacific. The presentation includes analyses, intercomparisons of retrievals and sondes, and statistical summaries. Next steps and preliminary results with updated retrievals are also discussed.

E N D
Validating Water Vapor Retrievals:Lessons Learned and Some Results Eric J. Fetzer and Annmarie Eldering Jet Propulsion Laboratory AIRS Science Team Meeting 30 March-1 April 2003 Greenbelt, Maryland
First Order of Business:JGR Special Issue • Our proposal for a Special Issue on AIRS validation was accepted by the JGR editor • Have manuscripts ready for peer review in the October or November
Overview of Today’s Talk • A Motivating Problem • Understanding water vapor in the subtropical eastern Pacific associated with temperature inversions • Analyses (v3.1.9) • Lots of maps of retrieved quantities • Intercompare retrievals and sondes along the west coast and Hawaii. Increasing complexity: • Intercompare matched profiles • Compare time series of retrieved and sonde T & q • Create statistical summaries • Next steps • First results with v3.5.0 and dedicated sondes
Motivating Problem • What is the water vapor distribution associated with retrieved temperature inversions in the eastern Pacific? • Inversion distribution present at October Sci. Tm. Meeting, Fall AGU. • GRL manuscript in preparation • Should be straightforward: • Over water • Mostly high pressure • Sonde stations on West Coast and Hawaii, with decent time match. • Not straightforward.
Lessons Learned: #0, #1 & #2 0. Temperature is much less variable than water vapor. • Water vapor is highly sporadic in space and time. • Maxima in water vapor are embedded in cloudy regions, where most of our questionable retrievals occur.
Lesson 1: The highly localized nature of water vapor (v3.1.9) 1 January 2003 1000-700 mb precipitable water vapor Full scale = 30 mm 700-500 mb precipitable water vapor Full scale = 6 mm
Lesson 2: Maxima in water vapor are embedded in cloudy regions with nonzero retrieval_type 1 January 2003 Retrieval type Gray = 0: Full IR Red = 10: 1st failed Blue = 20: MW & Strat IR Green = 30: MW & Strat IR Black = 100: Crash & burn X: |SST error| > 3 K. Error with forecast SST Black = -5 K Red = 5 K.
Intercomparing AIRS and Sondes • Look at December 2002 and January 2003 • Consider operational sondes at 6 locations: • Quillayute, Washington • Oakland, California • Vandenberg, California, • San Diego, California • Hilo, Hawaii • Lihue, Hawaii
Lesson #3: Highly variable water makes for nonstationary time series Precipitable Water Vapor, Lihue, Hawaii 1000-700 mb & 700-500 mb layers Blue = Sonde, Red = AIRS (diamond = nonzero rettyp)
Lesson #4: Water vapor at ‘upper’ levels can be highly variable Lihue, 700-500 mb dynamic range ~ 0.1 to 10 mm precipitable water Dave Tobin: ‘UTWV is the last precipitable 0.1 mm’
Lesson #5: Locally, conclusions like L. McMillin’s in Val ReportCaution: Standard deviation is not robust to outliers 1000-700 mb Lihue: 2.7 ± 14.1 % Bias ± Std. Dev. McMillin Globally: 3.6 ± 11.6 % 700-500 mb Lihue: -4.3 ± 44.3 % (15th & 85th percentiles:-19, +12%) McMillin Globally : 0.0 ± 26 % Lihue 700-500 mb 1.95 mm mean Lihue 1000-700 mb 20.5 mm mean
Lesson #6 • Trade wind cumulus regions are challenging • In Hawaii, a moist boundary layer is overlain by very dry, descending air • This explains the large standard deviation at Lihue. • Need to revisit this problem with dedicated sondes • Andros, Ascencion, others.
Lesson #7: Sippican sondes not consistent at upper levels The Goldilocks Effect? Vandenberg may have a combination of high relative humidity and temperature => Sippican sensitivity & low bias Oakland too cold? San Diego & Hilo too dry? Vandenberg just right? UNBIASED: ~few ± 15-45% BIASED: ~-15-30 ± 15-20% SEE da Silviera, R. B., G. Fisch, L. A. T. Machado, A. M. D’all Antonia, L. F. Sapucci, D. Fernandes and J. Nash, (2003) Executive summary of the WMO intercomparison of GPS radiosondes, WMO Instruments and Observing Methods Report No. 76, WMO/TD No. 1153.
Lesson #7 • Nonzero retrieval types contain potentially useful information about water vapor • THIS IS REFLECTED IN TIME AVERAGED FIELDS OAKLAND Blue crosses: Sonde Water Red Cross: AIRS Water, ret. type = 0; Red Diamond: AIRS, ret. type NE 0
Lesson # 8:The 1000-700 mb and 700-500 mb layers are statistically decoupled 1-16 January 2003 1000-700 mb water (mm) Also apparent in radiosonde difference statistics 1-16 January 2003 700-500 mb water (mm)
Some Conclusions from this study • Retrieval type (or RetQAFlag) bias our observations toward dry conditions • The results over the eastern Pacific is similar to Larry McMillin’s conclusions globally. • Higher variability => larger standard deviations at altitude • We have sensitivity in 2 km layers. • We are meeting 15% / 2 km RMS at ARM TWP up to 300 mb with v3.5.0.
Some Questions • What is our true vertical resolution for water vapor? • Statistically independent 1000-700 and 700-500 mb layers imply we can do better • E. G., can we resolve the abrupt transition from moist to dry over trade wind cumulus? • What is our true RMS uncertainty? • How strongly does this depend on the vertical distribution of q? • What is the information content of non-zero retrieval types?
Next Steps • Extend the analysis of dedicated sondes into others regions • Galapagos (Voemel) • Caribbean, Ascencion Is. (Schmidlin) • Chesapeake light platform (McMillan) • Extend the operational sondes westward over the Pacific 3. Look for regional variability in statistics For example: is high variability (~45%) over Hawaii at 700-500 mb seen at Ascencion Is? 4. Move over land…
The Latest: TWP Dedicated Sondes and Version 3.5.0 Looking GoodBlack = RMS,Red = Std Dev, Blue = Bias 18 Nov 2002 to 31 Jan 2003 26 sondes, 45 matches with rettyp = 0 and landfrac = 0. Bias ~10%, RMS <35%up to 150 mb In 1 km layers RMS = 8-15% in 2 km layers up to 300 mb 100-700 mb 700-500 mb 500-300 mb Standard layers: 100-925 mb, 925-850, etc.