Download
1 / 9
220 likes | 914 Views
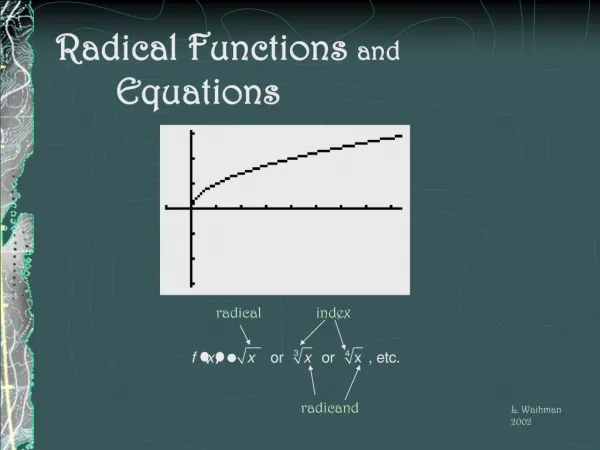
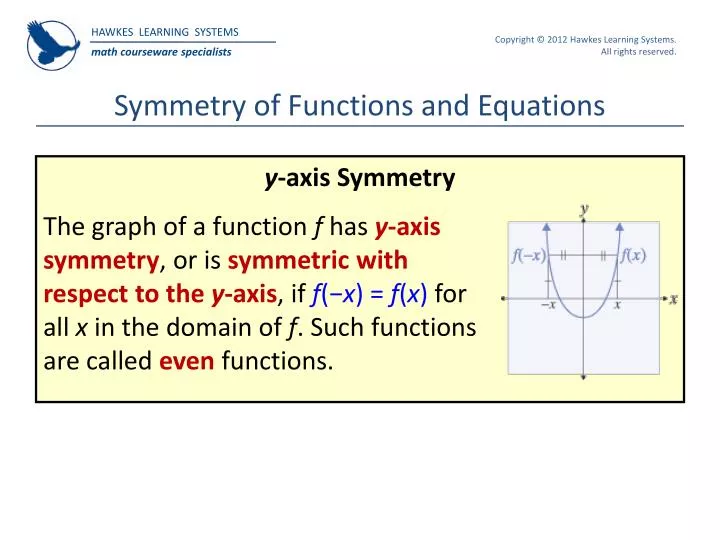
Symmetry of Functions and Equations. y -axis Symmetry. The graph of a function f has y -axis symmetry , or is symmetric with respect to the y -axis , if f (− x ) = f ( x ) for all x in the domain of f . Such functions are called even functions. Symmetry of Functions and Equations.

E N D
Symmetry of Functions and Equations y-axis Symmetry The graph of a function f has y-axis symmetry, or is symmetric with respect to the y-axis, if f(−x) = f(x) for all x in the domain of f. Such functions are called even functions.
Symmetry of Functions and Equations Origin Symmetry The graph of a function f has origin symmetry, or is symmetric with respect to the origin, if f(−x) = −f(x) for all x in the domain of f. Such functions are called odd functions.
Symmetry of Functions and Equations Symmetry of Equations We say that an equation in x and y is symmetric with respect to: 1. The y-axisif replacing x with −x results in an equivalent equation. 2. The x-axisif replacing y with −y results in an equivalent equation. 3. The originif replacing x with −x and y with −y results in an equivalent equation.
Example Sketch the graphs of the following relations. Solutions: a. This relation is actually a function, one that we have already graphed. Note that it is indeed an even function and has y-axis symmetry:
Example (cont.) b. We do not quite have the tools yet to graph general polynomial functions, but g(x) = x3 − x can be done. For one thing, g is odd: g(−x)= −g(x) (as you should verify). If we now calculate a few values, such as g(0) = 0, g (1) = 0, and g(2) = 6, and reflect these through the origin, we begin to get a good idea of the shape of g.
Example (cont.) c. The equation x = y2 does not represent a function, but it is a relation in x and y that has x-axis symmetry. If we replace y with −y and simplify the result, we obtain the original equation: The upper half of the graph is the function so drawing this and its reflection gives us the complete graph of x = y2.
Intervals of Monotonicity Increasing, Decreasing, and Constant We say that a function f is: 1. Increasing on an intervalif for any x1 and x2 in the interval with x1 < x2, it is the case that f(x1) < f(x2). 2. Decreasing on an intervalif for any x1 and x2 in the interval with x1 < x2, it is the case that f(x1) > f(x2). 3. Constant on an intervalif for any x1 and x2 in the interval, it is the case that f(x1) = f(x2).
Example Determine the intervals of monotonicity of the function Solution: We know that the graph of f is the parabola shifted 2 units to the right and down 1 unit, as shown in the graph.
Example (cont.) From the graph, we can see that f is decreasing on the interval (−, 2) and increasing on the interval (2, ). Remember that these are intervals of the x-axis: if x1 and x2 are any two points in the interval (−, 2), with x1 < x2, then f(x1) > f(x2). In other words, f is falling on this interval as we scan the graph from left to right. On the other hand, f is rising on the interval (2, ) as we scan the graph from left to right.