Download
1 / 30
300 likes | 389 Views
Motion Graphs. Distance and Displacement. Distance is a scalar quantity! is how far something has moved. is measured in metres etc. Displacement is a vector quantity. is how far an object has moved from its starting point and in what direction.

E N D
Distance and Displacement
Distance • is a scalar quantity! • is how far something has moved. • is measured in metres etc. • Displacement • is a vector quantity. • is how far an object has moved from its starting point and in what direction. • measured in metres but also has a direction. • is the (straight line) distance between 2 points with the direction given too!
If the bear skis the 7 metres to the tree then back to the start and then all the way to the house, what distance would he have gone? _______m
What would his displacement from the starting point be ? ___________ m in an easterly direction.
Speed and velocity
Speed is a scalar quantity! • It is how fast something has travelled • It is measured in metres/second or km/hour. • Velocity is a vector quantity. • This is how fast and in what direction something travels IN A STRAIGHT LINE!!! • This is measured in m/s or km/h but also has a direction.
Speed • If a car travels 150 km in 2 hours then calculate the average speed of the car: Average Speed = distance travelled/ time = d/t = 150 km/ 2 h = 75km/h Or write it like this: = 75 km h ⁻¹
Velocity • If a plane travels 480 km in a southerly direction for 2 hours then calculate the average velocity of the plane: Average velocity= distance travelled in a straight line time Vav = s/t = 480 km/ 2 h South = 240km/h South Or write it like this: = 240 km h ⁻¹ South
Remember that if an object is going at a constant speed but changes direction (turns) then its velocity changes!!
All these abbreviations – what do they stand for???!!! d = distance s = displacement t = time v= velocity or final velocity u = initial velocity a = acceleration
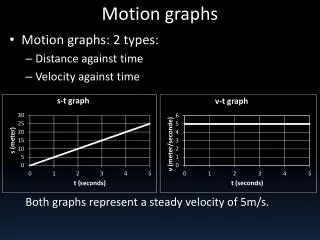
Motion graphs It is often easier to show the motion of an object with a graph rather than with words. There are 2 types of graph we will look at: • Displacement – time graphs or distance – time graphs. • velocity - time graphs or speed- time graphs. VELOCITY (v)is simply speed in a given direction DISPLACEMENT (s) is the distance in a given direction
With both types of graph, time is plotted on the x axis. • The further to the right along the x axis we go – the longer the time from the start! • Velocity, distance etc are always plotted on the y axis. • We assume the initial direction of motion to be positive.
Distance (m) 0 1 2 3 4 5 6 7 8 9 10 11 A body at rest. That is it is stopped or standing still! 0 1 2 3 4 5 6 7 8 9 10 11 12 time (s)
An object moving at constant speed. Constant speed because the lines are straight! Which line shows the object going fastest? Distance (m) 0 1 2 3 4 5 6 7 8 9 10 11 0 1 2 3 4 5 6 7 8 9 10 11 12 time (s)
Speed is given in m/s so we can work out the speed here by saying speed = rise/run = distance/time. Work it out for each. Distance (m) 0 1 2 3 4 5 6 7 8 9 10 11 0 1 2 3 4 5 6 7 8 9 10 11 12 time (s)
A body accelerating! You can see that the speed is increasing: the distance travelled is more each second so this shows it is accelerating!! Distance (m) 0 1 2 3 4 5 6 7 8 9 10 11 0 1 2 3 4 5 6 7 8 9 10 11 12 time (s)
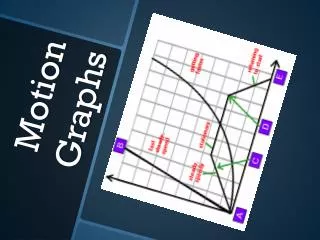
Lets look at an example: First we will give the information in words then as a displacement – time graph. Matthew starts from point A and travels at 2m/s for 3 seconds to point B. He then stops at point B for 4 seconds before going back towards point A at an initial velocity of -1.5m/s for 2 seconds then stopping at an intersection for 1 second before continuing to point A at -1.5 m/s. Ok – lets look at this graphically!!!!!
Much Easier than words!!! Distance (m) 0 1 2 3 4 5 6 7 8 9 10 11 Matthew’s trip 0 1 2 3 4 5 6 7 8 9 10 11 12 time (s)
Lets do some questions!
This axis has SPEED not distance on it!!!! What is the difference between this graph and the ones we looked at before?? Speed (m/s) 0 1 2 3 4 5 6 7 8 9 10 11 0 1 2 3 4 5 6 7 8 9 10 11 12 time (s)
So what does this graph show? Speed (m/s) 0 1 2 3 4 5 6 7 8 9 10 11 It shows that the object is moving at a constant speed of 5.5m/s 0 1 2 3 4 5 6 7 8 9 10 11 12 time (s)
What does this graph show? Speed (m/s) 0 1 2 3 4 5 6 7 8 9 10 11 It shows that the objects’ speed is increasing or the object is accelerating! 0 1 2 3 4 5 6 7 8 9 10 11 12 time (s)
What does this graph show? Speed (m/s) 0 1 2 3 4 5 6 7 8 9 10 11 It shows that the objects’ speed is decreasing or the object is decelerating! 0 1 2 3 4 5 6 7 8 9 10 11 12 time (s)
Which line shows faster acceleration? Green or blue? Acceleration = speed/time so Blue = 3m/s/s Green = 1m/s/s Steeper slope = faster acceleration! Speed (m/s) 0 1 2 3 4 5 6 7 8 9 10 11 0 1 2 3 4 5 6 7 8 9 10 11 12 time (s)
Putting it all together: Speed (m/s) 0 1 2 3 4 5 6 7 8 9 10 11 Steady speed Fast deceleration Or negative acceleration Fast accn Slow accn 0 1 2 3 4 5 6 7 8 9 10 11 12 time (s)
What other information can we get from displacement – time and speed time graphs? Speed (m/s) 1 2 3 4 5 6 7 8 Distance (m) 10 20 30 40 50 60 1 2 3 4 5 6 7 8 9 Time (s) 1 2 3 4 5 6 7 8 9 Time (s) Gradient = rise/run = 7/7 = 1m/s/s = acceleration!!! Area under the graph = ½ time x speed = s x m/s = m = distance travelled!!! Gradient = rise/run = 30/6 = 5m/s = speed!
Lets look at the last example and work out the distance travelled.
Work out the area under the line to work out the distance travelled Speed (m/s) 0 1 2 3 4 5 6 7 8 9 10 11 0 1 2 3 4 5 6 7 8 9 10 11 12 time (s)
Reading – Pages 3 to 4 Can you stick the sheet in too?