Download
1 / 31
310 likes | 448 Views
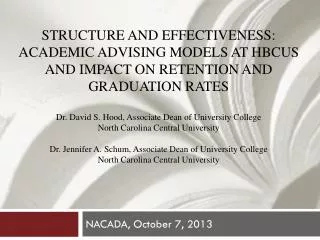
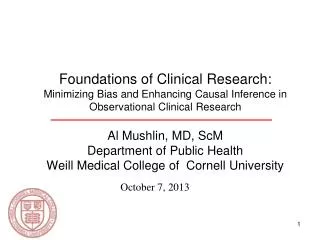
Foundations of Clinical Research: Minimizing Bias and Enhancing Causal Inference in Observational Clinical Research Al Mushlin, MD, ScM Department of Public Health Weill Medical College of Cornell University. October 7, 2013. How Research Works. ACTUAL STUDY. RESEARCH QUESTION. STUDY PLAN.

E N D
Foundations of Clinical Research:Minimizing Bias and Enhancing Causal Inference in Observational Clinical Research Al Mushlin, MD, ScMDepartment of Public HealthWeill Medical College of Cornell University October 7, 2013
How Research Works ACTUAL STUDY RESEARCH QUESTION STUDY PLAN design implement Target population Intended sample Actual subjects Random & systematic error Random & systematic error Phenomena of interest Intended variables Actual measurements infer infer TRUTH IN THE UNIVERSE TRUTH IN THE STUDY FINDINGS IN THE STUDY
Two Kinds of Errors: no study is perfect! errors solutions Study design, implementation, and quality control Patient selection and sampling Sample size, correct measurements and statistical calculations • Systematic (bias) • Random (statistical)
Bias “Any systematic error in the design, conduct or analysis of a study that results in a mistaken estimate of an exposure’s effect on the risk of disease” From Gordis, Epidemiology, 2000
Two General Types of Bias • Selection bias: The study does not reveal the truth because of the individuals studied. • Information (ascertainment/measurement) bias: The study does not reveal the truth because of errors in the information collected.
Types of Selection Bias • Problems with sampling, inclusion/exclusion criteria, or participation • The population(s) selected is not representative • Exclusion bias: • The study group excludes individuals who should have been in the population(s), limiting comparability. • Non-response bias: • People who do not participate are different from those who do.
Types of Information Bias • Misclassification bias • Recall bias • Reporting bias • Detection bias • Measurement bias
Minimizing Bias • Use random or systematic sampling • Avoid unneeded inclusion and exclusion criteria • Employ accurate measurements • Use double-blinded procedures • Participants and investigators should be unaware of group assignments • Aim for high response rate
Systematic Error and Study Validity: • How well study measured what it intended to measure (internal validity) • How well the study measured truth in the universe (external validity) • Internal validity is necessary but not sufficient for external validity • internal plus external validity are required for "generalizability”
The Next Important Question: • Even if there is no bias or random error in the study, what are explanations for the results other than what was found is a true association; that it is a cause-and-effect relationship?
The Next Important Question: • Even if there is no bias or random error in the study, what are explanations for the results other than what was found is a true association; that it is a cause-and-effect relationship? • Answer: • The relationship is reversed: effect-cause • Another factor/variable is confounding the relationship…….and is the real cause
Exposure Confounder Outcome Confounding An apparent relationship between an exposure and an outcome that is really caused by a 3rd variable (the confounder)
Definition of Confounding • When there is a variable that is associated both with the predictor (independent) variable and a cause of the outcome (dependent) variable
Coffee and Risk of MI • Research question: Is coffee drinking a cause of myocardial infarction? • Design: Case-control study • Results: OR=2.25 From Designing Clinical Research, 2013: Appendix 9A
Possible Interpretations: • Study has revealed the truth • Study finding is due to chance • Study is biased • Study findings are confounded by another unexamined variable
Is There a Confounder? Coffee Drinking ? Myocardial Infarction
Example : Coffee and Smoking OR = 16 Coffee drinking is associated with smoking From DCR: Appendix 9A
Is There a Confounder? Coffee Smoking MI
Smoking and MI OR = 4 Smoking is associated with MI From DCR Appendix 9A
Smoking is a Potential Confounder Coffee Drinking Smoking MI
A Stratified Analysis Confirms a Confounder Smokers Non Smokers OR=1 OR=1 From DCR: Appendix 9A
A Stratified Analysis Confirms a Confounder OR=2.25 OR = 1 From DCR: Appendix 9A
Minimizing Confounding • Measure potential confounders! • Consider options during the design or latter, during the analysis • Cannot adjust for unconsidered or unmeasured potential confounders • Randomize when feasible and ethical
Study Design Options to “Control” for Confounders • Sampling • Specification • Matching/stratification • “Opportunistic” Study Designs • Natural experiments • Mendelian randomization • Instrumental variables
Analyses Adjusting for Confounders • Stratification • Multivariate Adjustment • Creates a hypothetical estimate (a model) of risk • What would the odds of MI be in coffee drinkers vs. non drinkers if smoking (and other potential confounders) were equally frequent in both groups? • Propensity Scores • When “confounding by indication” is a concern
Exposure Effect Modifier Outcome “Interaction” and Effect Modifiers SUBGROUP 1 SUBGROUP 2 Exposure Effect Modifier Outcome
A Stratified Analysis Suggests that Coffee is an Effect Modifier OR = 11 OR = 1.01 Source: DCR Appendix 9A
The Challenge is to Identify Variables in the Causal Pathway Exposure Other Variables in the Causal Pathway Outcome
Additional Evidence for Causality • Consistency of finding • Strength of the association • Dose response relationship • Biologic plausibility
Take Home Messages • Be aware of threats to the validity of your study: chance, bias, directionality, confounding • Anticipate and address problems before you begin • Recognize the need to tease apart confounders and effect modifiers • Consider the strength of the evidence for causality