Download
1 / 19
210 likes | 558 Views
Methods of Assessing Freshness Quality of Chill-Stored Fish. Fisheries Laboratory Department of Food Technology TEI Athens. Competent Authorities to Safeguard Consumers’ Interests. Safety. Intrinsic Composition. Nutritional Value. Wet Fish Quality. Availability. Yield &

E N D
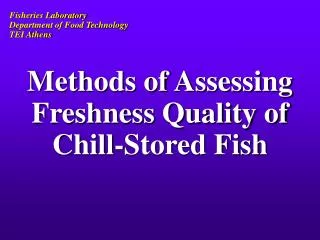
Methods of AssessingFreshnessQuality ofChill-Stored Fish Fisheries Laboratory Department of Food Technology TEI Athens
Competent Authorities to Safeguard Consumers’ Interests Safety Intrinsic Composition Nutritional Value Wet Fish Quality Availability Yield & Profitability Convenience Integrity Freshness Appearance Palatability Odor Flavor Attributes Determining Quality as Perceived by Consumers
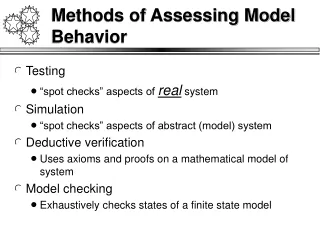
Methods used to Assess Freshness Quality of Chilled Fish Sensory Methods Wholly dependent upon human senses Non-Sensory Methods Instrumental Subjective Objective Chemical Physical Microbiological Trained Experts Required Structured Scaling Quality Index Method Profiling ▪ High degree of sensory sensitivity ▪ Experience in sensory methodology ▪ Biases deliberately minimized
Batches of Fish (Whole/Gutted) Council Regulations 103/76, 2406/96 Grading of Fish Freshness in the EU Point of first sale (Port Markets) Trained Assessors EU Schemes (33 Species) Inspection Skin Belly Cavity Outer Slime Gills Eyes Grading B Grade Extra A Grade
The EU Scheme … ►Takes no account of detailed species differences ▪ Not species-specific ►Does not describe accurately different levels of freshness quality ▪ Fish in the same grade may have quite different freshness characteristics (e.g. Top A/Low A) ►Gives no information on remaining storage life A new rapid scaling method, the Quality Index Method (QIM), has been suggested as an alternative to the EU scheme
Principles of QIM ▪ Appropriate sensory attributes are evaluated in sequence ▪ Each attribute is scored from 0 to 3, 0 indicating best quality ▪ The scores of all attributes are summed to give the total demerit score (Quality Index) ▪ QI increases linearly with time of iced storage, making easy to predict remaining shelf life ▪ No feature can excessively unbalance the score However, a separate scheme should be developed for each species
Changes in Quality Index of Whole Iced Gilthead Sea Bream Quality Index Remaining Shelf Life (days) B Grade A Grade Extra Days in ice Extra A Grade B Grade
TVB-N, TMA and other Volatile Amines Fraction of volatile bases in spoiling fish muscle
TMA as an Indicator of Spoilage Usefulness of TMA depends upon ►Level of TMAO in fish muscle ▪ High in elasmobranches and deep-sea finfish ▪Unevenly distributed through the body of pelagics ▪Absent from most fresh water species ► Presence of TMAO-reducing bacteria ▪ Shewanella putrefaciens (air - vacuum) ▪ Photobacterium phosphoreum (MAP - vacuum) ▪ Most Pseudomonas spp.do not reduce TMAO ► Storage conditions ▪ Air, Vacuum, MAP
TMA as an Indicator of Spoilage ▪ Unsuitable for fresh- water fish ▪ Lack of significant change during early stages of spoilage ▪ Method suitable for evaluating medium to poor freshness quality fish ▪ TMA levels at sensory rejection depend on storage conditions Not specified in EU Legislation Sensory rejection (48% CO2) a • Cod (MAP) • Cod (air) • Sea bream (air) • Nile perch (air) TMA-N (mg/100 g) Sensory rejection (air) b c d Days of storage at 0 °C
TVB as Spoilage Indicator • Applicable to all species of finfish However, only useful as spoilage indicator • More useful with squid cuttlefish • To be used when sensory evaluation reveals doubt to the freshness of fish (Directive 91/493/EEC Fish Hygiene) • Limit values for salmon, cod, hake, redfish and several flatfish (Regulation95/149/EEC) European hake TVB-N (mg/100 g) E A Grade B Grade Unfit Days in ice
Postmortem nucleotide degradationin fish muscle ATP Pi ADP Steps catalyzed exclusively by autolytic enzymes Reactions go to completion within 48 hours Pi AMP NH3 IMP IMP degradation results in loss of fresh flavors Pi Rate limiting steps Spoilage bacteria also involved Ino Hx contributes bitter flavor Hx
K-value as an Indicator of Freshness Ino + Hx x 100 K-value (%) = ATP + ADP + AMP + IMP + Ino + Hx • Linear increase during ice storage of many fish • Less variable than single compound quality indices (e.g. Hx, IMP) • However, not universallyapplicable - Extensive analyses required • 20% critical limit value for fish to be consumed raw (sushi) - Japan • K-value not included in EU/US regulations Cod Sea bass Albacore K-value Sea bream Days in ice
Textural Measurements(hardness, shear force, elasticity) Gilthead Sea Bream Gutted fish Penetration Force (g) Skinless fillets TA.XT2 Texture analyzer Whole fish Days in Ice Drawbacks: Lack of uniform structure along fillet Expensive instrumentation - Destructive sampling Zwick hardness tester
Color Measurements(flesh and skin) Color greatly influences CDP Major quality parameter of ■ Salmonids ■ Tuna ■ White fish fillets Tristimulus Colorimetry Hunter L, a, b system CIE L* a* b* system L/L* = lightness (0-100) a/a* = red-greenness b/b* = yellow-blueness Salmonids ■ Non-destructive assessment of intact fish and fish fillets ■ Cost of instrument, time required for measuring large numbers of samples and variability can limit usefulness White fish
Storage Life Prediction Based onDielectric Properties Gilthead sea bream Confidence intervals for 90% probability Remaining Shelf Life (days) Elapsed Time in Ice (days) Advantages ■ Fast ■ Non-destructive ■ Minimal training requirements Not useful with ■ Thawed fish ■ Fish stored in chilled sea water GR-Torrymeter Reading
Specific Spoilage Organism Concept(adapted from Dalgaard, 2000) Typical Spoilage Organisms Aerobic Storage ▪ S. putrefaciens ▪ Pseudomonas spp. Vacuum or MAP ▪ P. phosphoreum ▪ LAB ▪ B. thermosphacta SSO growth models available for shelf life prediction TVC SSO Metabolites Spoilage Level Chemical Spoilage Index Metabolite concentration Log CFU g-1 Shelf life Storage time (days)
Specific Spoilage Organismsin Chill-Stored Fish 1 Iron Agar Lyngby (20°C, 3d); 2Cetrimide-Fucidin-Cephaloridine (CFC) Agar (20-25°C, 3d) or using a conductance method; 3 Malthus conductance method (15°C, 10-50h); 4 MRS Agar; 5 Streptomycin sulfate Thallous Acetate Actidione (STAA) Agar (25°C, 2-3d); 6 Tryptic Soy Agar (TSA) with overlay of Violet Red Bile Glucose (VRBG) Agar (30°C, 48h)
Freshness Determination by aTraceability System(Modified from Frederiksen et al., 2002) Catch Temperature recording from harvest through distribution & display Harvesting operations Chilling on board vessel • Relative Rate of Spoilage(temperate water fish) • RRS = [0.1 x T(°C) + 1]2 • Freshness determination • based on Time-Temperature • history of product can be • Easier to manage • More cost efficient • More reliable Fish temperature Wholesaler Chilled transport to retailer Auction Unloading Time after harvesting (days)