1 / 5

Figure S1

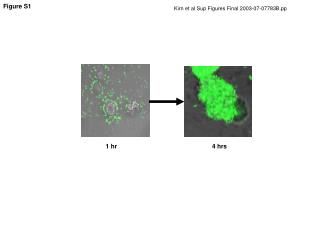
1 hr. 4 hrs. Figure S1. Figure S2. Time (min). Figure S3. Figure S4. S5. B. WT. ∆ gbpA. 1.0x10 9. A. 1.3x10 8. 1.2x10 8. 1.0x10 8. CFU/ml. WT. ∆ gbpA. 2.6x10 8. 1.0x10 7. 2.1x10 8. 1.0x10 6. 1.6x10 8. 1.6x10 8. 10 mg/ml GlcNAc. CFU/ml. 1.1x10 8. 7.3x10 7. 6.0x10 7. C.

satin
Download Presentation

Figure S1

An Image/Link below is provided (as is) to download presentation Download Policy: Content on the Website is provided to you AS IS for your information and personal use and may not be sold / licensed / shared on other websites without getting consent from its author. Content is provided to you AS IS for your information and personal use only. Download presentation by click this link. While downloading, if for some reason you are not able to download a presentation, the publisher may have deleted the file from their server. During download, if you can't get a presentation, the file might be deleted by the publisher.

E N D

Presentation Transcript


  1. 1 hr 4 hrs Figure S1

  2. Figure S2 Time (min)

  3. Figure S3

  4. Figure S4

  5. S5 B WT ∆gbpA 1.0x10⁹ A 1.3x10⁸ 1.2x10⁸ 1.0x10⁸ CFU/ml WT ∆gbpA 2.6x10⁸ 1.0x10⁷ 2.1x10⁸ 1.0x10⁶ 1.6x10⁸ 1.6x10⁸ 10 mg/ml GlcNAc CFU/ml 1.1x10⁸ 7.3x10⁷ 6.0x10⁷ C 1.0x10⁷ WT ∆gbpA 1.0x10¹⁰ 1.0x10⁹ 2.9x10⁸ 2.7x10⁸ CFU/ml 1.0x10⁸ 1.0x10⁷ 1.0x10⁶ 100 mg/ml GlcNAc

More Related