Download
1 / 1
30 likes | 184 Views
W/E: 14 th April 2013. HO restricted infrastructure: weekly dashboard. OVERALL EXPERIENCE. APPLICATION PERFORMANCE.

E N D
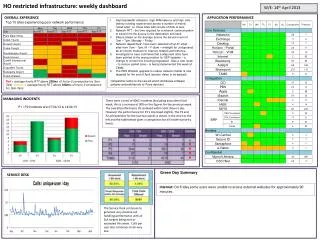
W/E: 14th April 2013 HO restricted infrastructure: weekly dashboard OVERALL EXPERIENCE APPLICATION PERFORMANCE High bandwidth utilisation, high WAN latency and high citrix latency is being experienced across a number of mainly “small sites” i.e. those sites with circuits of 2mb or less. Network RTT - the time required for a network communication to travel from the source to the destination and back. Data is based on the average across the service hours of 7am – 7pm, Monday – Friday. Network dispatchers* have been switched off at 47small sites from 7am – 7pm, M – F (6am – midnight for Juxtaposed) as an interim measure to improve network performance . Investigations have confirmed that Juxtaposed sites have been pointed at the wrong location for SEP updates – a change to correct this is being progressed. Also a new router – to reduce packet sizes - is being implemented this week at Calais. The RES Wisdom upgrade to reduce network chatter is now targeted for the end of April (precise dates to be agreed). *(dispatcher refers tothe service which distributes software updates and patches etc to Poise devices). Top 10 sites experiencing poor network performance Red= average hourly RTT above 250ms >2 hrs(or 2 consecutive hrs 7pm-7am) Amber-= average hourly RTT above 100ms >2 hrs(or 2 consecutive hrs 7pm-7am) MANAGING INCIDENTS There were a total of 4062 incidents (excluding auto alerts) last week, this is a increase of 909 on the figures for the previous week. The overall performance (% resolved within SLA) shows a dip. However the performance for P1’s improved slightly. The P1 and P2 achievement for the last two weeks is shown in the chart to the left and the table below gives a comparison for all incident priority levels. P1 / P2 Incidents w/e 07/04/13 & 14/04/13 Green Day Summary SERVICE DESK Internet: On Friday some users were unable to access external websites for approximately 90 minutes. The Service Desk continues to generate very positive call handling performance with all SLA targets being met or exceeded this week. Calls per user also continues to be very low.