Download
1 / 39
510 likes | 1.03k Views
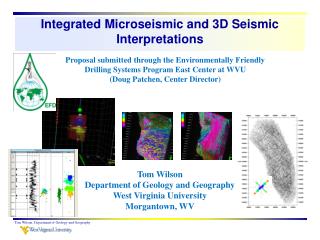
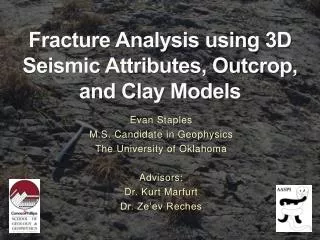
Fracture Analysis using 3D Seismic Attributes, Outcrop, and Clay Models. Evan Staples M.S. Candidate in Geophysics The University of Oklahoma Advisors: Dr. Kurt Marfurt Dr. Ze’ev Reches. Outline. Research objective Data available Hunton Limestone and Woodford Shale Geology

E N D
Fracture Analysis using 3D Seismic Attributes, Outcrop, and Clay Models Evan Staples M.S. Candidate in Geophysics The University of Oklahoma Advisors: Dr. Kurt Marfurt Dr. Ze’ev Reches
Outline • Research objective • Data available • Hunton Limestone and Woodford Shale Geology • Proposed Work Flow • Overview of Seismic Attributes and Image Logs • Work Completed • Future Work • Preliminary Conclusions • Acknowledgements • References Cited • Questions
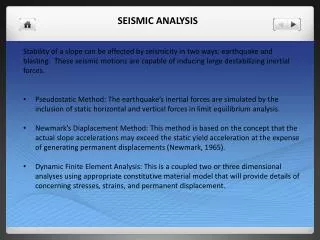
Research Objective Use surface seismic, outcrop data, image log data, and clay models to quantitatively identify and characterize fracture zones in the subsurface. This is important because fractures are smaller than seismic resolution, yet are often critical to porosity and permeability
Outline • Research objective • Data available • Hunton Limestone and Woodford Shale Geology • Proposed Work Flow • Overview of Seismic Attributes and Image Logs • Work Completed • Future Work • Preliminary Conclusions • Acknowledgements • References Cited • Questions
Data Available • Outcrop of basal Woodford Shale on Highway 77 near the Arbuckle Mountains in Oklahoma • Clay models in laboratory • Laser generated surfaces of both outcrop and clay models. • 9 square miles of proprietary 3D seismic survey from Pathfinder Exploration, LLC • 8 proprietary horizontal image logs within 3D seismic survey from Pathfinder Exploration, LLC totaling approximately 10 miles Major geologic provinces of Oklahoma (After Northcutt and Campbell, 1995)
Outline • Research objective • Data available • Hunton Limestone and Woodford Shale Geology • Proposed Work Flow • Overview of Seismic Attributes and Image Logs • Work Completed • Future Work • Preliminary Conclusions • Acknowledgements • References Cited • Questions
Hunton Geology • Hunton Group: • Late Ordovician to Early Devonian • Woodford Shale lies unconformably above • Consists of shallow-marine carbonates deposited on a gently inclined ramp. • Is laterally extensive in Oklahoma (Al-Shaieb et al., 2001). Lateral Extent of Hunton Group Major geologic provinces of Oklahoma (After Northcutt and Campbell, 1995) (Adapted from Johnson, 1990 and Walker and Geissman, 2009)
Woodford Geology • The Woodford Shale is: • Devonian black shale • Stratigraphically beneath the Caney Shale and above the Hunton Group • From a deep water origin • Hydrocarbon rich shale • Is laterally extensive in Oklahoma(Ataman, 2008) Lateral Extent of Woodford Shale Major geologic provinces of Oklahoma (After Northcutt and Campbell, 1995) (Adapted from Johnson, 1990 and Walker and Geissman, 2009)
Outline • Research objective • Data available • Hunton Limestone and Woodford Shale Geology • Proposed Work Flow • Overview of Seismic Attributes and Image Logs • Work Completed • Future Work • Preliminary Conclusions • Acknowledgements • References Cited • Questions
PSTM seismic data Interpret Depth convert and load horizontal image logs Reformat 0.2” scale image log data to fractures/seismic bin Calculate seismic attributes and identify potential “fracture swarms” Cross correlate image log fracture density to seismic attributes Proposed Work Flow – Exploratory Data Analysis Correlating Seismic Attributes to High-Resolution Subsurface Control NO Correlation > Rmin Visually correlate image log boreholes with seismic attributes YES Useful Attributes More attributes? YES NO STOP
Proposed Work Flow – Exploratory data analysis Correlating Seismic Attributes to Fracture Characterization in Outcrop Visually correlate curvature with areas of high fracture density Use laser to scan outcrop and clay model and create digital surface Calculate curvature on digital surface Cross correlate outcrop fracture density to curvature Outcrop and clay model data Identify and characterize fractures in outcrop and clay model data NO Correlation > Rmin YES Useful Attributes YES NO More attributes? STOP
Outline • Research objective • Data available • Hunton Limestone and Woodford Shale Geology • Proposed Work Flow • Overview of Seismic Attributes and Image Logs • Work Completed • Future Work • Preliminary Conclusions • Acknowledgements • References Cited • Questions
Overview – Curvature Seismic Attribute • Anticline: k > 0 • Plane: k = 0 • Syncline: k < 0 k=0 k>0 k=0 k<0 Flat Plane Anticline Dipping Plane R Syncline x Courtesy Kurt Marfurt z
- 4 -2 +4 40 ms 0 +2 Maximum coherence Overview – Coherence Seismic Attribute Shifted windows of Trace #2 Trace #1 Cross correlation lag: Cross correlation of 2 traces Courtesy Kurt Marfurt
Overview – Coherence Seismic Attribute Low coherence along time slices High coherence along dip Importance of computing coherence along structural dip Courtesy Kurt Marfurt
Overview – Coherence vs. Curvature Normal fault seen by curvature and coherence Strike slip fault not seen by curvature but by coherence Flexure not seen by coherence but by curvature Courtesy Kurt Marfurt
Overview – Image Logs • Alternating Current (AC) ~ 30 in into formation • Measures resistivity similar to laterolog • Approximate resolution is 0.2 in. Images and setup description courtesy Schlumberger
Outline • Research objective • Data available • Hunton Limestone and Woodford Shale Geology • Proposed Work Flow • Overview of Seismic Attributes and Image Logs • Work Completed • Future Work • Preliminary Conclusions • Acknowledgements • References Cited • Questions
Work Completed – 3D Attribute Analysis 1 km Hunton Formation vertically exaggerated to show structure • Initial Hunton interpretation • Attributes: • Curvature (Pos and Neg) • Coherence • Co-rendering • Visual correlation with image logs • Identification of potential“Fracture Swarms” Time (ms) Amp 0.90 Pos 0 Neg 0.93 N
Work Completed – 3D Attribute Analysis 1 km Amp Curv Pos Pos Positive Curvature Negative Curvature 0 0 Neg Neg Short Wavelength N N Long Wavelength N N
Work Completed – 3D Attribute Analysis • Areas of incoherence along horizontal image log borehole • Potential areas for high fracture density N
Work Completed – 3D Attribute Analysis Positive Curvature Negative Curvature • Areas of incoherence and positive curvature along image log borehole • Potential areas for high fracture density Short Wavelength Long Wavelength
Work Completed – Image Log QC • Two types of fractures • Layer-bound fractures • Fractures that cut across multiple bedding layers • Exhibit suspected alteration (“Halo”) Low Porosity Limestone Shale Clay and Silt Sand Limestone Conductive Resistive Adapted from Schlumberger EMI Description
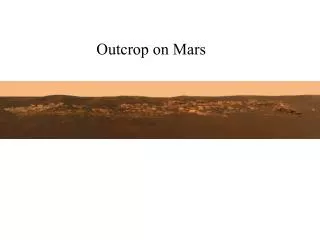
Work Completed – Outcrop Identification and Preliminary Fracture Analysis
Work Completed – Outcrop Identification and Preliminary Fracture Analysis
Outline • Research objective • Data available • Hunton Limestone and Woodford Shale Geology • Proposed Work Flow • Overview of Seismic Attributes and Image Logs • Work Completed • Future Work • Preliminary Conclusions • Acknowledgements • References Cited • Questions
Future Work • Image Log Fracture Analysis • Identify fracture swarms • Calculate fracture: • Orientation, density, intensity, spacing, open/closed • Reformat 0.2” image log scale to seismic scale • Cross-correlate fracture swarms from image logs with seismic attributes
Future Work • Woodford Shale Fracture Analysis • Identify fracture swarms • Calculate fracture: • Orientation, density, intensity, spacing, open/closed • Create digital surface of outcrop and calculate curvature • Cross-correlate fracture swarms with curvature
Future Work • Clay Model Fracture Analysis • Identify fracture swarms • Calculate fracture: • Orientation, density, intensity, spacing • Create digital surface of clay models and calculate curvature • Cross-correlate fracture swarms with curvature
Outline • Research objective • Data available • Hunton Limestone and Woodford Shale Geology • Proposed Work Flow • Overview of Seismic Attributes and Image Logs • Work Completed • Future Work • Preliminary Conclusions • Acknowledgements • References Cited • Questions
Preliminary Conclusions • Co-rendering positive curvature with coherence highlights potential high fracture density areas with 3D Seismic • Image logs contain two main fracture types • Layer-bound • Layer-cutting • Woodford Shale outcrop is significantly fractured • Potential analogs for subsurface fracture networks • Initial clay model deformation appears to simulate natural tectonic processes • Potential analogs for subsurface fracture networks
Acknowledgements • Pathfinder Exploration, LLC for 3D seismic data and horizontal image logs • Schlumberger for Petrel and Techlog licenses • AASPI (Attribute-Assisted Seismic Processing and Interpretation) Consortium for 3D seismic attribute software • Dr. Kurt Marfurt, University of Oklahoma • Dr. Ze’ev Reches, University of Oklahoma
References Cited • Al-Shaieb, Z., J. Puckette, and P. Blubaugh, 2001, The Hunton Group: Sequence stratigraphy, facies, dolomitization, and karstification: Oklahoma Geological Survey Circular 105, 17-29. • Al-Shaieb, Z., G. Beardall, P. Medlock, K. Lippert, F. Matthews, and F. Manni, 1993, Overview of Hunton facies and reservoirs in the Anadarko Basin: Oklahoma Geological Survey Special Publication 93, no. 4, 3-39. • Boyd, D. T., 2008, Stratigraphic guide to Oklahoma oil and gas reservoirs: Oklahoma Geological Survey Map SP 2008-1, 1 sheet. • Chopra, S., and K. J. Marfurt2007, Seismic attributes for prospect identification and reservoir characterization: Society of Exploration Geophysicists, Tulsa, OK. • Faith, J. R., Blome, C. D., Pantea, M. P., Puckette, J. O., Halihan, T., Osborn, N., Christenson, S., Pack, S., 2010, Three-dimensional geologic model of the Arbuckle-Simpson Aquifer, South-Central Oklahoma: United States Geological Survey, Reston, Virginia. • Hart, B. S.,2006, Seismic expression of fracture-swarm sweet spots, Upper Cretaceous tight-gas reservoirs, San Juan Basin: AAPG Bulletin, 90, 1519-1534. • Johnson, K. S., 2008, Geologic History of Oklahoma, in Educational Publication 9: 2008, Oklahoma Geological Survey, p. 3-8. • Narhari, S. R., A. L. Al-Kandari, V. K. Kidambi, S. Al-Ashwak, B. Al-Qadeeri, and C. Pattnaik,, 2009, Understanding fractures through seismic data: North Kuwait case study: The 79th Annual International Meeting of the SEG, Expanded Abstracts, 547-551. • Nissen, S. E., T. R. Carr, K. J. Marfurt, and E. C. Sullivan, 2009, Using 3-D seismic volumetric curvature attributes to identify fracture trends in a depleted Mississippian carbonate reservoir: Implications for assessing candidates for CO2 sequestration, in M. Grobe, J. C. Pashin, and R. L. Dodge, eds., Carbon dioxide sequestration in geological media—State of the science: AAPG Studies in Geology, 59, 297–319. • Sagy A. and Z. Reches, 2005. Joint intensity in sedimentary rocks: The unsaturated, saturated, supersaturated, and clustered classes. Submitted to Israel J Earth Sciences • Stanley, T. M., 2001, Stratigraphy and facies relationships of the Hunton Group, northern Arbuckle Mountains and Lawrence Uplift, Oklahoma, in Oklahoma Geological Survey Guidebook 33, 73 p.
k1< 0 k1= 0 k1> 0 synform k2< 0 saddle bowl antiform k2= 0 plane k2> 0 dome Geometries of folded surfaces (Bergbauer et al., 2003)
1.0 Time (s) 3 km 1.2 Radius of Curvature