
Introduction
Surface bi-directional reflectance properties over the ARM SGP area from satellite multi-platform observations. Luo, Y. a , Trishchenko, A.P. a , Latifovic, R. a , Li, Z. b (a) Canada Centre for Remote Sensing, (b) University of Maryland; Email: Yi.Luo@nrcan.gc.ca; trichtch@ccrs.nrcan.gc.ca.

Introduction
E N D
Presentation Transcript
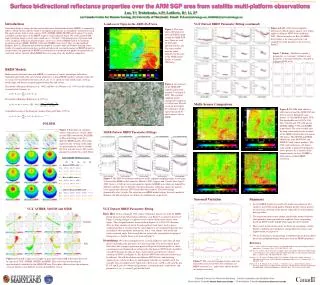
Surface bi-directional reflectance properties over the ARM SGP area from satellite multi-platform observations Luo, Y.a, Trishchenko, A.P.a, Latifovic, R.a, Li, Z.b (a) Canada Centre for Remote Sensing, (b) University of Maryland;Email: Yi.Luo@nrcan.gc.ca; trichtch@ccrs.nrcan.gc.ca Land-cover Types in the ARM-SGP Area VGT Dataset BRDF Parameter Fitting (continued) Introduction Good knowledge of surface bi-directional reflectance distribution function (BRDF) is required in order to obtain surface albedo, which is an important parameter in atmospheric radiation research. We analyzed data from several sensors (VGT, AVHRR, MISR, MODIS and Landsat-7) to study variability and dynamics of the BRDF shape in various spectral bands. We used Landsat ETM high-resolution image to select some small areas (~2x2 km2) with homogenous vegetation land cover (cropland, natural grassland/savannas, forest etc). Several BRDF models for medium-resolution sensors (MISR, MODIS, VGT and AVHRR) were tested. They are the modified-Rahman, Ross-Li, Roujean and model developed at Canada Centre for Remote Sensing. Some results of comparison between these models and observed seasonal dynamics of BRDF properties are presented. An approach for BRDF reconstruction is considered and applied for generation of consistent surface spectral albedo/BRDF data sets using clear-sky multiday composites. Figure 6 (Left). VGT 4-band cropland reflectances (black square) against view zenith angles at different NDVI levels in March 2002. The red triangles are Ross-Li BRDF fitted values at the same geometries. An example of model parameters are shown in Figure 7. Figure 3. This map shows the land-cover types in IGBP Legend around the ARM-SGP area. There are total 12 land types identified in this area. The cross-symbol near the center indicates the location of the ARM central facility at Lamont, Oklahoma. Figure 7 (Below). The Ross-Li model 3 parameters, i.e. isotropic, volumetric and geometric scattering coefficents, obtained at different NDVI levels. BRDF Models Bidirectional reflectance function (BRDF) is a measure of surface anisotropic reflectance dependent upon both solar and viewing geometries. A linear BRDF model is typically expressed as a sum of several kernel functions , s, v and are solar zenith angle, viewing zenith angle and relative azimuth angle between Sun and viewer. The model of Roujean (Roujean et al., 1992) and Ross-Li (Wanner et al., 1997) are all such kind of model with 3 kernels, i.e. Figure 4. An overview of the ARM-SGP central facility from Landsat-7 on March 9, 2002. The cropland sampling square corresponds roughly to a 2x2 km area. We will see in the next figure the reflectance of this square measured by other sensors such as MISR. The model of Rahman (Rahman et al. 1993) is Multi-Sensor Comparison Figure 8. The NIR band albedo or reflectance around the ARM-SGP area from 4 sensors during the same period, i.e. the middle of April, 2002. The bandwidths are 841-876, 846-886, 780-890 and 725-1100 nm for MODIS, MISR, VGT and AVHRR, respectively. The cross-symbol near the map centre indicates the location of the ARM central facility at Lamont, Oklahoma. The MODIS and MISR albedos are from MOD43B3 and MISR L2 land surface products. The VGT nadir reflectance (45-degree solar zenith) is generated through the above process. As a contrast to the improvements we leave AVHRR as observations without BRDF correction. A modified version of the Roujean’s model (Chen and Cihlar, 1997) is POLDER Figure 1. Polar plots of cropland surface reflectance at 3 bands (blue, red and NIR) observed by POLDER in May and fitting results by 3 different BRDF models. The radius represents the viewing zenith angle, the polar angle the relative azimuth between sun and viewer. The model parameters are listed in a table below. MISR Dataset BRDF Parameter Fittings Table of BRDF Model Parameters a0 a1 a2 a3 a4 ------ Roujean BRDF model ------ Blue 0.0702 0.0159 0.0314 Red 0.1519 0.0392 0.2158 NIR 0.2513 0.0627 0.3280 ------ Ross-Li BRDF model ------ Blue 0.0679 0.0142 0.0077 Red 0.1468 0.0354 0.0385 NIR 0.2435 0.0573 0.0527 ------ Modified Roujean BRDF model ------ Blue 0.0476 0.0049 0.0102 0.9010 7.8139 Red 0.1248 0.0127 0.1519 0.4765 8.6997 NIR 0.2153 0.0273 0.2451 0.3752 8.8474 Figure 5. The NDVI and surface reflectance of the cropland sampling square as in Figure 4 observed by MISR on the same day, March 9, 2002, (upper) and 3 weeks later, April 1, 2002 (lower). A 2x2 km2 area correspond to 4 pixels in MISR scan which are denoted by different symbols. Due to different vegetation densities within this square the 4 pixels have significantly different NDVI and reflectance features. They also change dramatically after 3 weeks. The color lines are BRDF model fittings, the red is model of Rahman, the blue and green are of Ross-Li and Roujean, respectively. MODIS 38N Seasonal Variation • Summary • Several BRDF models are tested with multi-sensor datasets. For whatever model the fitting quality depends greatly on how good is the geometric coverage of the dataset, especially for retrieving the hot-spot effect. • The vegetation density may change significantly within relatively short period of time especially for croplands. Data categorizing based on NDVI will be helpful when using the above models. • Most results shown in this poster are based on our primary studies. Further validation and comparison among different sensors, and improvement are in process. • We are in the process of generating a combined-dataset that includes data from multiple platforms with more accurate BRDF properties. • Reference • Chen, J., and J. Cihlar, A hot spot function in a simple bidirectional reflectance model for satellite applications, J. Geophys. Res., 102, 25,907–25,913, 1997. • Rahman, H., B. Pinty, and M. Verstraete, Coupled surface atmosphere reflectance (CSAR) model, 2, Semiempirical surface model usable with NOAA advanced very high resolution radiometer data, J. Geophys. Res., 98, 20,791–20,801, 1993. • Roujean, J. L., M. Leroy, A. Podaire, and P. Y. Deschamps, Evidence of surface reflectance bidirectional effects from a NOAA/AVHRR multitemporal data set, Int. J. Remote Sens., 13, 685–698, 1992. • Wanner, W., A. H. Strahler, B. Hu, P. Lewis, J.-P. Muller, X. Li, C. L. Barker Schaaf, and M. J. Barnsley, Global retrieval of bidirectional reflectance and albedo over land from EOS MODIS and MISR data: Theory and algorithm, J. Geophys. Res., 102, 17,143–17,161, 1997. 36N VGT, AVHRR, MODIS and MISR VGT Dataset BRDF Parameter Fitting Basic Idea 10-day composite VGT surface reflectance datasets are used for BRDF fitting. Instead of pixel-based data collection as in Figure 5, Landcover-based (see Figure 3) fitting strategy is employed to have observations from various view angles. The total pixel number for area like in Figure 3 is 1457x1112, therefore there are huge amounts of pixels for some primary land types, such as grass, cropland and forest. So data from the same landcover are categorized into data bins according to their geometric information, that is solar zenith, view zenith and relative azimuth angle. Data in each bin are statistically averaged before going to fitting process. Similar things were done in Figure 2. Methodology We collect fitting pixels for a certain landcover only when all other pixels surrounding this pixel have the same land type. This will avoid the pixel shift effect due to map re-projection process.All pixels with bad quality or cloud contamination are eliminated according to the flag dataset. NDVI levels should be considered because the data are from various pixels and they have a broad variation of NDVI (see Figure 5). For different NDVI the reflectance feature may be different. We will divide data into different NDVI levels, and do fitting separately for each level. Ross-Li and Roujean’s models are currently used. For example, Ross-Li model can be expressed as R=f_iso+f_vol*K_vol+f_geo*K_geo. K_vol and K_geo are volume and geometric scattering kernels, respectively, and parameters f_iso, f_vol and f_geo will be fitted. 34N January 96W 94W 100W 98W VEGETATION/SPOT4 July Figure 2. From left to right are examples of grassland surface NIR reflectance observed by sensors of VGT, AVHRR, MODIS and MISR. They are based on data from all grassland pixels identified in the ARM-SGP area. These plots illustrate how the geometric coverage pattern is for different seasons and different sensors. Figure 9. The seasonal variation of grass and crop land reflectances from VGT. The solid lines are BRDF corrected (i.e., nadir view) and the dashed are before correction.


