Comparative Efficacy of Ultrasound and MRI in Diagnosing Foot and Ankle Tendon Tears
This meta-analytic review assesses the diagnostic performance of musculoskeletal ultrasound (US) versus magnetic resonance imaging (MRI) for detecting tendon tears in the foot and ankle. Analyzing 28 studies with a total of 824 tendon evaluations, the study reveals that US demonstrates a superior overall sensitivity (93.2%) and specificity (89.8%) compared to MRI's sensitivity (91.0%) and specificity (81.3%). Given its higher accuracy and lower cost, US is recommended as the preferred first-line imaging modality for suspected isolated tendon tears in this anatomical region.

Comparative Efficacy of Ultrasound and MRI in Diagnosing Foot and Ankle Tendon Tears
E N D
Presentation Transcript
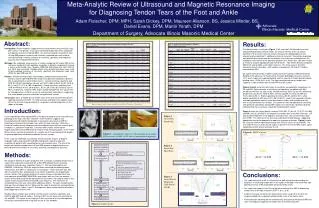
Meta-Analytic Review of Ultrasound and Magnetic Resonance Imaging for Diagnosing Tendon Tears of the Foot and Ankle Adam Fleischer, DPM, MPH, Sarah Dickey, DPM, Maureen Allanson, BS, Jessica Minder, BS, Daniel Evans, DPM, Martin Yorath, DPM Department of Surgery, Advocate Illinois Masonic Medical Center Abstract: Results: Introduction:Recent evidence suggests that musculoskeletal ultrasound (US) may offer similar, if not greater, accuracy for detecting tendon tears when compared to magnetic resonance imaging (MRI). Our aim was to better characterize how US and MRI perform in patients with clinically suspected tears of the foot or ankle by deriving summary estimates of sensitivity, specificity, and diagnostic accuracy from the published literature. Methods:We undertook meta-analysis of studies comparing US and/or MRI to the reference standard of intra-operative inspection in patients suspected of having a foot or ankle tendon tear. Medline, EMBASE and citation lists from 1980 to July 2010 were searched. Random effects meta-analytic techniques were used to derive pooled estimates of sensitivity, specificity and diagnostic odds ratio (DOR) for both MRI and US. Results:We identified 28 studies (824 tendons) comparing ultrasound (423 tendons) and/or high-field MRI (401 tendons) to operative inspection in patients with suspected foot or ankle tendon injuries. Overall sensitivity, specificity and DOR for US (95% confidence interval) was 93.2% (88.6 to 96.0), 89.8% (82.8 to 94.1), and 71.9 (27.2 to 189), respectively. Overall sensitivity, specificity and DOR for MRI was 91.0% (80.6 to 96.1), 81.3% (59.2 to 92.8), and 33.8 (12.0 to 95.0), respectively. However, MRI studies lacked homogeneity (Chi-square test for heterogeneity p < 0.05 for sensitivity and specificity calculations), suggesting that some pooled estimates should be interpreted with caution. Conclusion:US is a reliable test for tendon tears of the foot and ankle with greater reported accuracy than MRI. The high accuracy and lower cost supports using US as the first-line imaging modality in suspected, isolated tendon tears in this region of the body. The flow of articles is outlined in Figure 1. We scanned 1453 titles/abstracts and selected 99 potentially relevant articles for retrieval. Review of the full articles identified 17 that met the inclusion criteria. Review of the bibliographies of the selected articles identified 11 additional articles for inclusion. Two articles duplicated data published elsewhere and were excluded. One study was excluded where the radiologists were aware of the operative diagnosis of a tendon tear. We were unable to extract or analyze appropriate data from 5 articles. Two articles directly compared MRI to US and could be used in both analyses. The meta-analysis therefore included a total of 28 studies—423 tendons evaluated with US and 401 tendons evaluated with MRI. US studies were generally of higher quality than those looking at MRI performance. Blinding of the observers to the presence of tendon pathology occurred in just 64% (7/11) of all studies that reported blinding, and the majority of studies did not indicate blinding status (19/28, 68%) at all. The high overall prevalence of tendon tears suggests a slight selection bias for both MRI and US studies. Figures 3 and 4 show the Forest plots of sensitivity and specificity, respectively, for US and MRI. Point estimates of sensitivity and specificity are plotted, with 95% confidence intervals, for each study. Pooled sensitivity (95% CI) for US in detecting tendon tears was 93.2% (88.6 to 96.0), whereas pooled sensitivity for MRI was 91.0% (80.6 to 96.1). Pooled specificity for US was 89.8% (82.8 to 94.1), while pooled specificity for MRI was 81.3% (59.2 to 92.8). Lower than expected estimates and wider confidence intervals were observed for studies with multiple zero cells where a 0.5 correction was needed. Chi-square test for heterogeneity for sensitivity and specificity calculations among MRI studies was statistically significant (p<0.05), indicating that these estimates should be interpreted with caution. Figure 5 shows the Forest plot of summary DOR (95% CI) for US (71.9 [27.2 to 189]) and MRI (33.8 [12.0-95.0]) in the diagnosis of tendon tears of the foot and ankle. US clearly performed better in the diagnosis of tendon tears, with a DOR almost twice that of MRI. The Cochran Q test was also insignificant for both groups, suggesting appropriate enough homogeneity to report our summary estimates. Figure 6 shows the summary receiver operating characteristic (SROC) curves of US and MRI. The area under the curve (AUC) for US studies is greater than that for MRI studies, again suggesting a better overall accuracy for US. Abbreviations: ATT, Anterior TibialTendon, PB, PeroneusBrevis, PL, PeroneusLongus, PTT, Posterior TibialTendon, FDL, Flexor DigitorumLongus, n, number of tendons included, NS, Not Specified, P, Prospective, R, Retrospective Introduction: Figure 3. Forest Plot Sensitivity. Current opinion generally regards MRI as the gold standard for assessing soft tissue pathology of the foot and ankle. However, recent evidence suggests that musculoskeletal US affords comparable, if not greater, accuracy than MRI for detecting and characterizing tendon tears within the foot and ankle. With only a handful of studies directly comparing ultrasound performance with the criterion gold standard (i.e., operative inspection), and even fewer studies examining the diagnostic performance of MRI and US head-to-head, third party payers in the United States remain reluctant to reimburse for in-office use of musculoskeletal US despite its growing popularity and dramatic potential for cost-savings. In this study, we undertook a systematic review and meta-analysis of English-language studies evaluating US and MRI findings with respect to operative inspection for patients with suspected foot or ankle tendon injury. The aim of the project was to better compare how US and MRI perform in diagnosing tears by deriving definitive estimates of sensitivity, specificity, and diagnostic accuracy. MRI US c b Figure 6. SROC Curves. Figure 1. Longitudinal “split tear” of the peroneusbrevis tendon (PB) as seen on (a) MRI, (b) US, and (c) intra-operative inspection. a Figure 4. Forest Plot Specificity. MRI US Methods: AUC = 0.925 AUC = 0.958 MRI US We sought to identify all studies of patients with a clinically suspected tendon tear or rupture who underwent testing with US and/or MRI followed by the reference standard of intra-operative inspection (Figure 1). We searched Medline and EMBASE (1980 to July 2010) for original articles containing the following words “tendon tear” and “MRI” or “ultrasound” or “sonogram”. Three reviewers (SD, MA, JM) screened the titles and abstracts of all articles to identify a list of potentially relevant articles. We excluded studiesthat used a reference standard other than intra-operative examination; case series and studies with less than five patients; articles whose data could not be abstracted into 2x2 tables; non-original studies; and studies examining low-field extremity MRI units (Figure 2). The references of included articles were also scanned for additional articles. For each included article, data was then extracted into 2x2 tables and the study characteristics recorded by two independent raters (Tables 1 and 2). Discrepancies were checked and resolved by a third independent reviewer (AF). Random effects models were used to estimate overall sensitivity, specificity, and DOR for both MRI and US studies. Summary ROC curves were also examined for US and MRI. Chi-square test or Cochran-Q test was used to test for heterogeneity. All analyses were performed using SAS version 9.2 for Windows. Conclusions: Figure 5. Forest Plot of Diagnostic Odds Ratios (DOR). • Our study confirms that US is a strong test for both including and excluding the diagnosis of underlying tendon tear in this region of the body—with extremely high pooled sensitivity (0.93) and pooled specificity (0.90) values. • Our study also suggests that US may be more accurate than MRI indiagnosing tendon tears of the foot and ankle (DOR 71.9 vs. 33.8). • A higher accuracy and lower cost would clearly favor using US as the first-line imaging modality for suspected isolated tendon tears of the foot or ankle. • Formal decision modeling will be needed to fully characterize the place of MRI and US in the diagnostic algorithm of tendon tears of the foot and ankle. MRI US Pooled DOR = 33.8 Pooled DOR = 71.9 10 100 100 10 Figure 2.Search results.