Download
1 / 21
210 likes | 273 Views
HEALTH EXPECTANCIES IN SPAIN (1986-2002). Juan L. Gutiérrez Fisac Instituto de Información Sanitaria Ministerio de Sanidad y Consumo Spain. HEALTH EXPECTANCIES IN SPAIN. First calculations: DFLE, at the begninig of the 90’

E N D
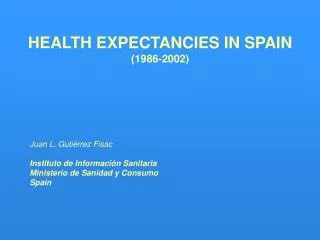
HEALTH EXPECTANCIES IN SPAIN(1986-2002) Juan L. Gutiérrez FisacInstituto de Información SanitariaMinisterio de Sanidad y ConsumoSpain
HEALTH EXPECTANCIES IN SPAIN • First calculations: DFLE, at the begninig of the 90’ • Survey on disability, impairments and handicaps (National Institute of Statistics, 1986) • Results were pubished at both: • Institutional report (Health Indicators) • Medical journal (Medicina Clinica)
Range (Higher-lower) = 3.2 5.8 7.7 3.8 5.6 5.9 3.2 15.1 16.1
In 1999, The National Institute of Statistics carried out a second disability survey, but unfortunately the definition of disability was different than in the 1986 survey, and we can not study trends in DFLE. • We started to calculate Life Expectancy in good perceived health, information available in the National health interview surveys carried out periodically in Spain since the end of the 80’s
LIFE EXPECTANCY IN GOOD PERCEIVED HEALTH Life tables: National Institute of StatisticsSelf perceived health: National Health Interview SurveyVery good, good vs fair, bad, very bad
Life expectancy (LE), life expectancy in good perceived health (LEGH) and number of years lived in bad health (YBH) at birth in Spain, 1986-2002 79.7 77.9 76.9 76.4 LEGH YBH
Life expectancy (LE), life expectancy in good perceived health (LEGH) and number of years lived in bad health (YBH) at birth in men and women in Spain, 1986-2002 Women Men 83.0 80.5 81.6 76.3 79.6 74.3 73.3 73.2 LEGH YBH
Percentage of years lived in good perceived health at birth. Spain, 1986-2002.
Absolute and relative change in LE and LE in good perceived health (LEGH) at birth in men and women. Spain, 1986-2002.
Life expectancy (LE), life expectancy in good perceived health (LEGH) and numbers of years lived in bad health (YBH) at 65 years in men and women in Spain, 1986-2002 Women Men 20.8 20.0 16.9 19.2 18.4 16.1 15.4 15 LEGH YBH
LIFE EXPECTANCY IN GOOD PERCEIVED HEALTH AT BIRTH IN 2002 < 51 51.0 – 51.6 51.7 – 55.6 55.7 – 59.5 > 59.5 (Range = 15 years) PERCENTAGE OF YEARS LIVED IN GOOD PERCEIVED HEALTH AT BIRTH IN 2002 < 62.7 62.7 – 65.5 65.6 – 69.6 69.7 – 74.3 > 74.3 (Range = 17 %)
Educational differences in LEGH • Number of deaths of people older than 24 years by sex, age and educational level in 1993: council deaths registers of Madrid and Barcelona • Population Census Data 1991 • Self-perceived health status from the National Health Interview Survey 1993 • Educational level: • Lower: Up to 11 years of school • Higher: 12 and more years of school
Life expectancy and life expectancy in good perceived health at 25 years of age by educational level in men and women in Madrid and Barcelona, 1993.
Life expectancy in bad health at 25 years old by educational level in Madrid and Barcelona. Women Men Lower education Higher education
Life expectancy and life expectancy in good perceived health at 65 years of age by educational level in men and women in Madrid and Barcelona, 1993.
CONCLUSIONS • Time trends • LE and LEGH at birth and at 65 years of age have been increasing since 1986 both in men and women. But a decreased in LEGH has been observed in women for the 1995-2002 period. • Gender differences • The percentage of years lived in good perceived health at birth is higher in men than in women. Moreover, while in men this percentage has remained stable from 1986, in women it has decreased in the last years.
CONCLUSIONS • Geographical differences • There are geographical differences in LEGH in Spain, with a North-South and East-West gradient that might be explained mainly by socioeconomic factors • Social differences • Differences by education are greater in LEGH than in LE