Download

1 / 25
250 likes | 470 Views
0. Income Distribution and Poverty. 18. How much inequality and poverty exist in our society? What policies are used to fight poverty? What are the problems with these policies?. Introduction. 0. Income is generally determined by earnings Earnings are a function of productivity

E N D
0 Income Distribution and Poverty 18 • How much inequality and poverty exist in our society? • What policies are used to fight poverty? • What are the problems with these policies?
Introduction 0 • Income is generally determined by earnings • Earnings are a function of productivity • What if productivity of resources varies across individuals? • The result is income inequality.
U.S. Inequality Over Time 0 Income share of the top 20% divided by income share of the bottom 20%
Lorenz Curve • The distribution of income can be represented by a Lorenz curve. • In a Lorenz curve: • the horizontal axis measures the cumulative percentage of households • the vertical axis measures the cumulative percentage of households
ACTIVE LEARNING 1: Lorenz Curve Using the distribution of income for 2005, draw a Lorenz curve. 6
ACTIVE LEARNING 1: Answer Create cumulative totals of the columns. 7
ACTIVE LEARNING 1: Answer Plot the cumulative number of households against the total share. 8
ACTIVE LEARNING 1: Answer A Lorenz curve that is a straight diagonal line would indicate an equal distribution of income. 9
Gini Coefficient • Another way to describe income inequality is by using a Gini coefficient. • related to the Lorenz curve
A B Gini Coefficient Let A = area between the line of perfect equality and the Lorenz curve Let B = area below the Lorenz curve Gini coefficient = A /(A + B) A higher Gini coefficient means greater inequality
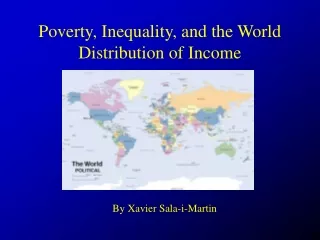
Inequality Around the World 0 Income share of the top 20% divided by income share of the bottom 20%
Gini Coefficients Around the World Green = greater equalityRed = greater inequality
Poverty 0 • Poverty line: an absolute level of income set by the government for each family size below which a family is deemed to be in poverty • Poverty rate: the percentage of the population whose family income falls below the poverty line • In 2005 in the U.S., • median household income = $46,326 • poverty line for family of four = $19,806 • poverty rate = 12.6%
The U.S. Poverty Rate Over Time 0 Percent of the population below poverty line
Policies to Reduce Poverty 0 • Poor families more likely to experience • homelessness • drug dependence • health problems • teen pregnancy • illiteracy • unemployment • Most people believe the government should provide a “safety net.” • We now consider a few such policies…
1. Minimum-Wage Laws 0 • Arguments for: • helps the poor without any cost to the government • little impact on employment if demand for unskilled labor is relatively inelastic • Arguments against: • In the long run, demand for unskilled labor is likely elastic, so minimum wage causes substantial unemployment among the unskilled. • Those helped by minimum wage are more likely to be teens from middle-income families than low-income adult workers.
2. Welfare 0 • Welfare: government programs that supplement the incomes of the needy • Temporary Assistance for Needy Families (TANF) • Supplemental Security Income (SSI) • Critics argue that such programs create incentives to become or remain needy • argue that welfare contributed to the rise of the single-parent family • The severity of such incentive problems is unknown
3. Negative Income Tax 0 • Negative income tax: a tax system that collects revenue from high-income households and gives transfers to low-income households • Example: Taxes owed = (1/3 of income) – $10,000 • If earnings = $90,000, taxes owed = $20,000 • If earnings = $60,000, taxes owed = $10,000 • If earnings = $30,000, taxes owed = $0 • If earnings = $15,000, taxes “owed” = –$5,000i.e., would receive $5000 payment from gov’t • The Earned Income Tax Credit (EITC) is similar to a negative income tax.
4. In-Kind Transfers 0 • In-kind transfers are goods or services provided to the needy. Examples: • homeless shelters • soup kitchens • food stamps • Medicaid • An alternative: cash payments
Anti-Poverty Programs andWork Incentives 0 • Assistance from anti-poverty programs declines as income rises. • Poor families face high effective marginal tax rates (exceeding even 100% in some cases!)