Download

1 / 33
330 likes | 431 Views
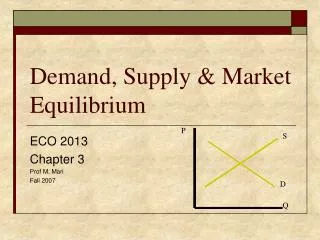
Where Prices Come From: The Interaction of Demand and Supply. The Demand Side of the Market. 3 - 1. Plotting a Price-Quantity Combination on a Graph. The Demand of an Individual Buyer.

E N D
The Demand Side of the Market 3 - 1 Plotting a Price-Quantity Combination on a Graph • The Demand of an Individual Buyer At a price of $125 per printer, Kate, the purchasing manager for the Prudential Insurance Company, will be willing to buy 5 printers in the next month. Quantity demandedThe quantity of a good or service that a consumer is willing to purchase at a given price.
Demand schedule A table showing the relationship between the price of a product and the quantity of the product demanded. Demand curve A curve that shows the relationship between the price of a product and the quantity of the product demanded. The Demand Side of the Market 3 - 2 Kate’s Demand Schedule and Demand Curve Demand Schedules and Demand Curves
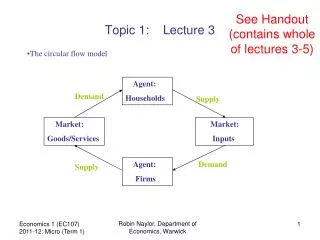
The Demand Side of the Market 3 - 3 Deriving the Market Demand Curve from Individual Demand Curves • Individual Demand and Market Demand Market demandThe demand for a product by all the consumers in a given geographical area.
The Demand Side of the Market • The Law of DemandThe Law of DemandHolding everything else constant, when the price of a product falls, the quantity demanded of the product will increases, and when the price of a product rises, the quantity demanded of the product will decrease. • What Explains the Law of Demand?Substitution effectThe change in the quantity demanded of a good that results from a change in price making the good more or less expensive relative to other goods that are substitutes.Income effect The change in the quantity demanded of a good that results from the effect of a change in the good’s price on consumer purchasing power.
The Demand Side of the Market • Holding Everything Else Constant:The Ceteris Paribus ConditionCeteris paribus(“all else equal”) The requirement that when analyzing the relationship between two variables—such as price and quantity demanded—other variables must be held constant.
The Demand Side of the Market 3 - 4 Shifting the Demand Curve Variables That Shift Market Demand • Price of related goods SubstitutesGoods and services that can be used for the same purpose.ComplementsGoods that are used together. • Income Normal goodA good for which the demand increases as income rises and decreases as income falls.Inferior goodA good for which the demand increases as income falls, and decreases as income rises. • Tastes • Population and demographics DemographicsThe characteristics of a population with respect to age, race, and gender. • Expected future prices
3 - 1 • Why Supermarkets Need to Understand Substitutes and Complements A supermarket shouldn’t remove a slow-selling soup from its shelves without researching whether shoppers use that soup as a substitute or a complement for another soup.
3 - 2 • Companies Respond to a Growing Hispanic Population Firms are responding to the tastes of a growing Hispanic population. Some Home Depot stores, for example, include signs in both English and Spanish.
The Demand Side of the Market 3 - 1 Variables That Shift MarketDemand Curves • Variables That Shift Market Demand
The Demand Side of the Market Variables That Shift MarketDemand Curves 3 - 1 (continued) • Variables That Shift Market Demand
The Demand Side of the Market 3 - 5 A Change in Demand versus a Change in the Quantity Demanded • A Change in Demand versus a Change in Quantity Demanded
3 - 3 • Estimating the Demand for Printers at Hewlett-Packard Inaccurate forecasts in 2001 caused Hewlett-Packard to produce more printers than they could sell.
The Supply Side of the Market • Quantity suppliedThe quantity of a good or service that a firm is willing to supply at a given price. Supply Schedules and Supply Curves Supply schedule A table that shows the relationship between the price of a product and the quantity of the product supplied. Supply curve A curve that shows the relationship between the price of a product and the quantity of the product demanded.
The Supply Side of the Market 3 - 6 Hewlett-Packard’s SupplySchedule and Supply Curve
The Supply Side of the Market 3 - 7 Deriving the Market Supply Curve from the Individual Supply Curves • Individual Supply and Market Supply
The Supply Side of the Market • The Law of Supply Law of supplyHolding everything else constant, increases in price cause increases in the quantity supplied, and decreases in price cause decreases in the quantity supplied.
The Supply Side of the Market 3 - 8 Shifting the Supply Curve Variables That Shift Supply • Price of inputs • Technological change A positive or negative change in the ability of a firm to produce a given level of output with a given amount of inputs. • Prices of substitutes in production • Expected future prices • Number of firms in the market
The Supply Side of the Market 3 - 2 Variables That Shift MarketSupply Curves • Variables That Shift Supply
The Supply Side of the Market Variables That Shift MarketSupply Curves 3 - 2 (continued) • Variables That Shift Supply
The Supply Side of the Market 3 - 9 The Difference between a Change in Supply versus a Change in the Quantity Supplied • A Change in Supply versus a Change in Quantity Supplied
Market Equilibrium: Putting Demand and Supply Together 3 - 10 Market Equilibrium Market equilibriumA situation where quantity demanded equals quantity supplied. Competitive market equilibrium A market equilibrium with many buyers and many sellers.
Market Equilibrium: Putting Demand and Supply Together 3 - 11 The Effect of Surpluses and Shortages on the Market Price • How Markets Eliminate Surpluses and Shortages SurplusA situation in which the quantity supplied is greater than the quantity demanded. Shortage A situation in which the quantity demanded is greater than the quantity supplied.
3 - 1 • Demand and Supply Both Count: A Tale of Two Letters Although the demand for Lincoln’s letters is greater than Booth’s, the supply of Booth’s letters is much smaller, which explains why the equilibrium price for Booth’s letters is higher.
The Effect of Demand and Supply Shifts on Equilibrium 3 - 12 The Effect of a Decrease in Supply on Equilibrium • The Effect of Shifts in Supply on Equilibrium
3 - 4 • The Falling Price of LargeFlat-Screen Televisions Corning’s breakthrough spurred the manufacture of LCD televisions in Taiwan, South Korea, and Japan, and an eventual decline in price.
The Effect of Demand and Supply Shifts on Equilibrium 3 - 13 The Effect of an Increase in Demand on Equilibrium • The Effect of Shifts in Demand on Equilibrium
The Effect of Demand and Supply Shifts on Equilibrium 3 - 14 Shifts in Demand and Supply over Time • The Effect of Shifts in Demand and Supply over Time
The Effect of Demand and Supply Shifts on Equilibrium 3 - 13 The Demand for Chicken Has Increased MoreThan the Supply • The Effect of Shifts in Demand and Supply over Time
3 - 2 • High Demand and Low Prices in the Lobster Market? Supply and demand for lobster both increase during the summer, but the increase in supply is greater than the increase in demand, therefore, equilibrium price falls.
Remember: A Change in a Good’s Price Does Not Cause the Demand or Supply Curve to Shift. The second shift, from D2 to D3, does not occur. After an increase in demand, from D1 to D2, the higher resulting price does not lead to a leftward shift of the demand curve to D3.
Picking a Big Fight with Dell, H-P Cuts PC Profits Razor-Thin
Ceteris paribus (“all else equal”) • Competitive marketequilibrium • Complements • Demand curve • Demand schedule • Demographics • Income effect • Inferior good • Law of demand • Law of supply • Market demand Market equilibrium Normal good Quantity demanded Quantity supplied Shortage Substitutes Substitution effect Supply curve Supply schedule Surplus Technological change