Download
1 / 15
170 likes | 406 Views
Population ecology. Cohort life table = life table based on individuals of same age (i.e. a cohort) followed from birth to death. Life tables used to study demography. Survivorship (l x ): proportion of individuals that survive from birth to age x. l x = N x /N 0.

E N D
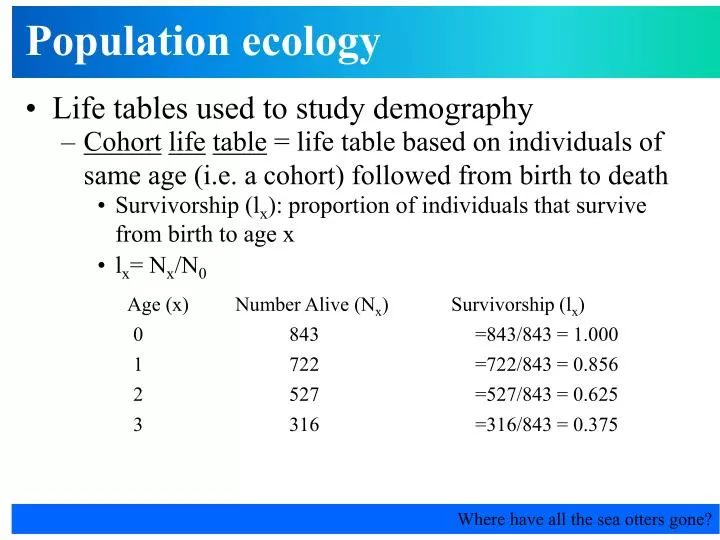
Population ecology • Cohortlifetable = life table based on individuals of same age (i.e. a cohort) followed from birth to death • Life tables used to study demography • Survivorship (lx): proportion of individuals that survive from birth to age x • lx= Nx/N0 Age (x) Number Alive (Nx) Survivorship (lx) 0 843 =843/843 = 1.000 1 722 =722/843 = 0.856 2 527 =527/843 = 0.625 3 316 =316/843 = 0.375 Where have all the sea otters gone?
Population ecology • Mortality (Mx): Proportion of individuals that die between ages x and x+1 • Life tables • Mx= (Nx-Nx+1)/Nx Age (x) Number Alive (Nx) Mortality (Mx) 0 843 =(843-722)/843= 0.143 1 722 =(722-527)/722 = 0.270 2 527 =(527-316)/527 = 0.400 3 316 Where have all the sea otters gone?
Population ecology • Survivorship curves show change in survivorship with age • Survivorship vs. age • y-axis on log scale (makes constant survivorship into a straight line) Where have all the sea otters gone?
Population ecology • Three general patterns • Type I: high survivorship early, low survivorship late in life • Survivorship curves • Type II: constant survivorship throughout life • Type III: low survivorship early, high survivorship late Where have all the sea otters gone?
Population ecology • Life tables summarize life-history traits • Life-historytrait = traits associated with organism’s life cycle • age at first reproduction (maturity) • number of offspring (fecundity) • number of reproductive bouts (parity) • Semelparity = reproduce once in lifetime • Iteroparity = reproduce multiple times during lifetime • lifespan (aging) Where have all the sea otters gone?
Population ecology • Life histories involve trade-offs • Resources limited; if resources used for one life-history trait then fewer resources available for another life-history trait • Life-history traits • Increased fecundity in birds correlates with higher mortality Where have all the sea otters gone?
Population ecology • Many other life history trade-offs observed • Early vs. late fecundity • Life-history traits • Number and size of offspring • Nestling weight is smaller when clutch sizes are larger in Great tits • Uta lizards with surgically reduced clutch sizes produce larger eggs Where have all the sea otters gone?
Population ecology • Understanding population growth an important part of demography • What causes population growth? • Increases: births and immigration • Decreases:deaths and emigration • Births and deaths usually measured as rates • Birth rate = # births per year • Birth rate = # births per 1,000 individuals per year • Birth rate = # births per individual per year Where have all the sea otters gone?
Population size Per capita growth rate Population growth rate Population ecology • Growth rates measured in two ways: • Population growth rate = change in population size per unit time • Population growth • Per capita growth rate (r) = birth rate -death rate per individual (also called intrinsic rate of natural increase) • Exponential growth model • Population grows without limits (assume r constant) (total number of individuals in population) (contribution of each individual to population growth) (change in population size over time) Where have all the sea otters gone?
Population growth rate (dN/dt) is slope Population ecology • Exponential growth • Population growth rate increases as population size increases • Population growth Population size (N) Time (t) Where have all the sea otters gone?
Population ecology • Example of exponential population growth • Population growth Where have all the sea otters gone?
Population ecology • Does population growth continue without limits? • Number of resources usually prevent populations from growing exponentially • Population growth • Carryingcapacity (K) = maximum number of individual that an environment can support • Population growth rate = 0 when population reaches carrying capacity • At carrying capacity, population birth rate = population death rate Where have all the sea otters gone?
Adjustment for limited resources Population size Per capita growth rate Population growth rate Population ecology • Logistic growth model • Population growth rates decreases as population approaches its carrying capacity • Population growth Where have all the sea otters gone?
Population ecology • Logistic growth model • Logistic growth produces S-shaped curve; population growth rate decreases as N approaches K • Population growth Population size (N) K Time (t) Where have all the sea otters gone?
Population ecology • Examples of logistic growth • Population growth Where have all the sea otters gone?