Download
1 / 17
170 likes | 289 Views
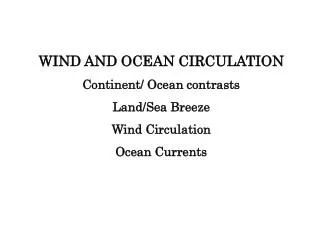
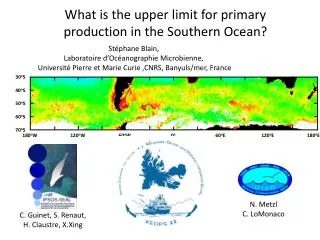
What is the upper limit for primary production in the Southern Ocean?. Stéphane Blain, Laboratoire d’Océanographie Microbienne, Université Pierre et Marie Curie , CNRS, Banyuls/mer, France. 30 o S. 40 o S. 50 o S. 60 o S. N. Metzl C. LoMonaco. 70 o S. C. Guinet , S. Renaut ,

E N D
What is the upper limit for primary production in the Southern Ocean? Stéphane Blain, Laboratoire d’Océanographie Microbienne, Université Pierre et Marie Curie ,CNRS, Banyuls/mer, France 30oS 40oS 50oS 60oS N. Metzl C. LoMonaco 70oS C. Guinet, S. Renaut, H. Claustre, X.Xing 180oE 120oE 60oE 120oW 180oW 60oW 0o (d’après Pollard et al., 2007)
Above the kerguelen plateau the interannualvariabilityof Net community Production (NCP) and air-sea CO2 flux was< 15 %
CTD FLUO Tag - Temperature - Salinity - Fluorescence 1 or 2 profiles/day (18 points per profiles) 21 animalsbetween 2008 and 2011 Calibration methods in Xing et al. L&O methods 2012 Guinet et al. ESSD 2013 Elephantseals of Kerguelen (MiroungaLeonina)
Climatology in the antarctic zone (between polar front and Southern Antarctic Circumpolar Current Front )
observed calculated PARML= 3.5 mol photon d-1
KEOPS2 PARML= 2.5 mol photon d-1 EIFEX (Smetacek et al. 2012)
Oct-Nov 2011 (KEOPS2) Feb 2012 (OISO 21) Lowsilicicacid concentrations limitdiatom growthat the end of the bloom.
air sea CO2 flux 3000 values between 1992 and 2012 (depth > 900 m) from OISO (C. Lo Monaco) CARIOCA buoydeployedduring KEOPS2 (J. Boutin) Preliminaryresult ˗1.0 ±0.2 mol C m-2y-1
Summary : In naturallyironfertilizedregions the amount of chlorophyll thataccumulates in the mixed layer iscontrolled by self-shading Considering self shading control, chlorophyll in the mixed layer couldbehigher and therefore the CO2sinkcouldbedeeper. Possible : If silicicacidsupplyincreases If Si/C of diatomsdecreases