Download
1 / 24
240 likes | 378 Views
Monitoring Pediatric Emergency Room Use with the National Health Interview Survey. Renee M. Gindi Division of Health Interview Statistics, NCHS. National Conference on Health Statistics August 7, 2012. National Center for Health Statistics. Centers for Disease Control and Prevention.

E N D
Monitoring Pediatric Emergency Room Use with the National Health Interview Survey Renee M. GindiDivision of Health Interview Statistics, NCHS National Conference on Health StatisticsAugust 7, 2012 National Center for Health Statistics Centers for Disease Control and Prevention
Outline • Pediatric emergency room (ER) use and the Affordable Care Act (ACA) • Determinants of pediatric ER use • Using NHIS to examine associations with pediatric ER use • Summary and next steps
Affordable Care Act and Pediatric ER Use Medicaid expansion: • Planning: Predicting access needs • Current concerns: • Cost control • Denial of payment for “unnecessary” ER use • Understanding reasons for ER visits
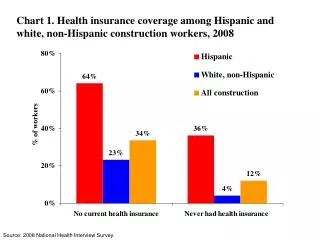
Correlates of Pediatric ER Use PREDISPOSING • Sociodemographic and neighborhood factors (age, single parent, poverty, lack of parental education, urbanicity) • Health insurance • Usual source of care • Preventive care • Timely access to and satisfaction with provider • Unmet medical needs • Poor health ENABLING NEED
2011 NHIS Sample: 40,300 families 102,000 persons 33,00 sample adults 12,850 sample children Methods: Study Population
Methods: Questionnaire Content Emergency room use: • Number of ER visits for the child in the past 12 months If at least one visit… • Hospital admission for last ER visit • If not admitted, reason for last ER visit • Eight reasons • Can select more than one
Methods: Questionnaire Content PREDISPOSING • Age • Poverty • Urbanicity • Insurance coverage status • Usual place of care in past 12 months • Preventive care visit in past 12 months • Problems with accessing provider • Unmet medical needs • Health status • Seriousness of medical problem • Hospital admission ENABLING NEED
Percentage of children visiting the ER one or more times in the past 12 months, by age group: U.S., 2009-2011 0-4 years 27.8% 22.8%
Percentage of children aged 0-17 using the ER, by poverty and urbanization: U.S., 2011
Percentage of children aged 0-17 using the ER, by insurance coverage status: U.S., 2011 Insurance Coverage Status
Percentage of children aged 0-17 using the ER, by usual place of care and receipt of preventive care: U.S., 2011
Percentage of children aged 0-17 using the ER, by unmet medical needs and health status: U.S., 2011
Correlates of hospital admission after ER visit in past 12 months among children aged 0-17: U.S., 2011 Increased likelihood of admission • Within MSA (vs. outside MSA) • Poor/near poor (vs. not poor) • Medicaid/CHIP or Uninsured (vs. Privately insured) • Fair/poor health status(vs. excellent/very good) No difference in admission • Usual place for health care • Unmet medical need • Receipt of preventive care
Percentage with reason for last ER visit, among children aged 0-17 whose last visit in past 12 months did not result in hospital admission: U.S., 2011
Percentages of children aged 0-17 with specific type of reason for ER visit, by insurance coverage type: U.S., 2011
Summary PREDISPOSING • Age, poverty, urbanicity as expected • Medicaid/CHIP • Associated with more ER use • Associated with more admissions • Associated with lack of access reasons • Usual place / Preventive care not as expected • Health status as expected • Unmet need not as expected ENABLING NEED
Next Steps • Stratified / adjusted statistical analyses • Expanded universe for “reason for visit” questions • State-based analyses • Trend analyses
Percentage with reason for last ER visit, among adults aged 18–64 whose last visit in past 12 months did not result in hospital admission: U.S., Jan–Jun 2011 Source: Gindi RM, Cohen RA, Kirzinger WK. Emergency room use among adults aged 18–64: Early release of estimates from the National Health Interview Survey, January–June 2011. National Center for Health Statistics. May 2012.
ER visits for children under 18 years, by age group: United States, 2008-2010
ER visits for children under 18 years, by age group: United States, 2010 Bloom, Cohen, and Freeman. Summary Health Statistics for U.S. Children: National Health Interview Survey, 2010.