Download
1 / 33
340 likes | 521 Views
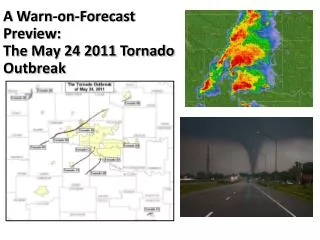
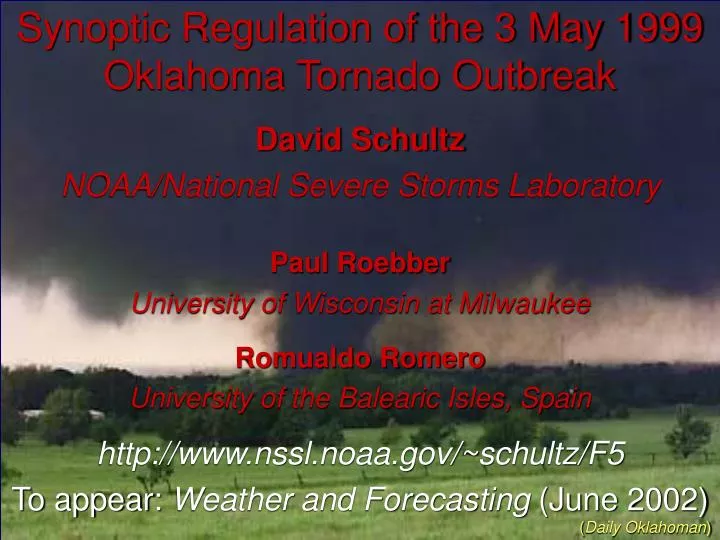
Synoptic Regulation of the 3 May 1999 Oklahoma Tornado Outbreak. David Schultz NOAA/National Severe Storms Laboratory Paul Roebber University of Wisconsin at Milwaukee Romualdo Romero University of the Balearic Isles, Spain http://www.nssl.noaa.gov/~schultz/F5

E N D
Synoptic Regulation of the 3 May 1999 Oklahoma Tornado Outbreak David Schultz NOAA/National Severe Storms Laboratory Paul Roebber University of Wisconsin at Milwaukee Romualdo Romero University of the Balearic Isles, Spain http://www.nssl.noaa.gov/~schultz/F5 To appear: Weather and Forecasting (June 2002) (Daily Oklahoman)
(Jarboe) (Schultz) (Jarboe) (Lindley) (Schultz) (Lindley) (Peppler) (Carey) (Zaras)
(Travis Smith, NSSL) •Moore 0131 UTC 0022 UTC 2341 UTC 0221 UTC 0311 UTC 0400 UTC
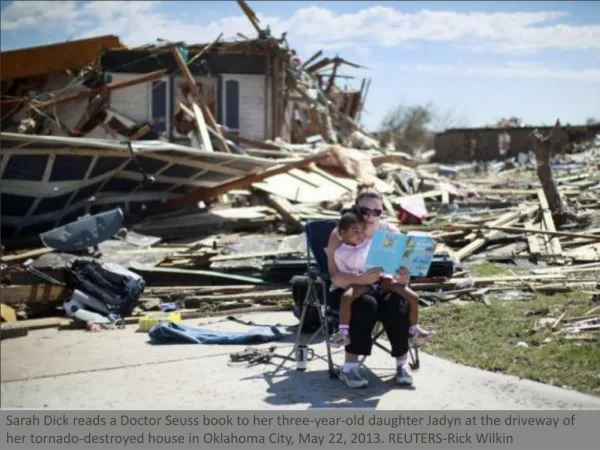
The Outbreak: Facts • 66 tornadoes, produced by 10 long-lived and violent supercell thunderstorms • Oklahoma City’s first F5 tornado • Almost 2300 homes destroyed and 7400 homes damaged • Over $1 billion in damage, the nation’s most expensive outbreak • 45 fatalities, 645 injuries in Oklahoma • About 500–700 expected fatalities in days before outlook/watch/warning system (Brooks)
Map of Tornado Tracks • Moore • Norman 40 km
Forecast Success • Forecasts from the Storm Prediction Center were updated as forecaster confidence grew • First tornado watch preceded the F5 tornado by 2.5 hours • The Forecast Office in Norman, Oklahoma, issued 31 severe thunderstorm and 48 tornado warnings with48mins. of avg. lead time for F2 and greater tornadoes (18 mins. lead time for all tornadoes) (NWS)
Despite the Successes, Considerable Uncertainty Existed Among Forecasters • Jet streak/shortwave trough (PV filament or southern PV anomaly) • initial and forecast strength of this feature • Cirrus • Would the cirrus inhibit destabilization? • Associated with tropospheric-deep ascent? • Dryline • diffuse, with weak surface convergence
0000 UTC 3 May 1999 northern PV anomaly 1200 UTC 3 May 1999 southern PV anomaly 0000 UTC 4 May 1999 pressure (hPa) on dynamic tropopause (1.5-PVU surface) CNTL simulation •Moore
Satellite Imagery low clouds cirrus 1745 UTC 3 May 1999
Satellite Imagery (Thompson and Edwards 2000)
Satellite Imagery (Thompson and Edwards 2000)
Satellite Imagery •Moore (Thompson and Edwards 2000)
Objective Through observations and numerical-modeling investigations, explore the impact of the three processes hypothesized by forecasters to be important in the outbreak: dryline, cirrus, and PV filament. Modeling experiments: We’re not considering explicit prediction of the supercells, but investigating the environment in which they formed.
Model Characteristics • MM5: cold start with initial and lateral conditions provided from the 0000 UTC 3 May forecast cycle of the AVN • 4 domains: 54-km, 18-km, 6-km, 2-km • 23 levels • Reisner, Kain–Fritsch (outer two domains), Blackadar PBL, cloud radiation every 2 min, 5-layer soil model
•Moore Stage IV Radar/Gauge Precip. Analysis (Baldwin and Mitchell 1997)
2300 UTC 0000 UTC CNTL d4 pink: 1.5-km w (> 0.5 m/s) blue: 9-km cloud-ice mixing ratio (>0.1 g/kg) 0100 UTC 0200 UTC
PBL Similarities: Observed and Model • Convection initiated within relatively homogeneous air mass • Diffuse/double dryline • “Billow” clouds 17°C 2100 UTC 3 May: surface dewpoint (every 2°C), vertically integrated cloud water and cloud ice
Convective Initiation thin lines: 1800 UTC thick lines: 2240 UTC (10 minutes prior to convective initiation) warm cap removed moist layer deepened
Convective Initiation in Cirrus Gaps 2210 UTC 2230 UTC 9-km cloud-ice mixing ratio maximum vertical motion in column 2250 UTC 2310 UTC
300-mb cloud ice 400-mb PV & height (filtered) Role of PV filament in Producing Cirrus 2000 UTC 2100 UTC 2200 UTC 0000 UTC
Modeled Storms as Supercells • Identify updrafts(>5 m/s) correlated with vertically coherent relative vorticity for at least 60 minutes • 22 supercells, 11 of which are on OK–TX border • Can’t address tornadogenesis
Experiments • CNTL: control simulation • NOPV: PV filament removed from initial conds. • 2XPV: PV filament doubled in initial conds. • NOCR: cloud-radiative effects turned off
PV-Surgery Methodology • Compute mean and anomaly PV from 0000 UTC 3 May to 0300 UTC 4 May. • Isolate PV filament from PV-anomaly field at 0000 UTC 3 May. • Use PV inversion to calculate the induced flow (wind, temperature, and height) associated with the PV filament (Romero 2001; Davis and Emanuel 1991) • Remove PV filament, restart MM5 without the filament in the initial conditions
Initial Conditions NOPV CNTL
NOPV vs 2XPV Precipitation accumulated precipitation: 1800 UTC 3 May to 0300 UTC 4 May 1,5,10,15,25,50,100 mm
CNTL Quantifying importance of PV filament pressure on tropopause 2100 UTC 3 May •Moore 0300 UTC 4 May
NOPV Quantifying importance of PV filament pressure on tropopause 2100 UTC 3 May •Moore 0300 UTC 4 May
2XPV Quantifying importance of PV filament pressure on tropopause 2100 UTC 3 May •Moore 0300 UTC 4 May
Summary • 30-h forecast produced long-lived supercells, albeit with errors in timing and location, regardless of southern PV anomaly strength. • Convective initiation was favored east of the dryline in weakened cap: lower-level moistening and synoptic-scale ascent due to PV anomaly. • Breaks in cirrus were favored locations for convective initiation, but were neither necessary nor sufficient. • Cirrus shield limited widespread convection and reduced competition between storms.