
Exploring Maps: Importance and Geographic Systems
E N D
Presentation Transcript
Standards • Use appropriate technologies to collect, analyze and communicate scientific data • Convey results of investigations using diagrams, charts and other data displays
Why Are Maps Important? • Maps represent the real world on a much smaller scale • They help you travel from one place to another • They record, organize, and communicate information
Geographic Coordinate System • Uses latitude & longitude as a reference grid to determine location on Earth. • Earth’s axis of rotation provides reference points for defining directions • These reference points are the geographic north and south poles • Halfway between the north and south poles is the equator – a line that divides the Earth into northern and southern hemispheres
Latitude • Latitude lines run east and west parallel to the equator • Also known as parallels • The equator is the reference line of latitude, so it equals 0 latitude
Latitude • Since Earth is a sphere, the circumference of Earth is 360 • Latitude lines are measured from 0 at the equator to 90 at the pole, and are specified as being north or south • Each degree of latitude is equal to 111 km on Earth’s surface
Latitude • Degrees of latitude are further broken down into smaller units called minutes and seconds • Minutes – there are 60 minutes in 1 degree, so each minute = 1.85 km • The symbol for minutes is ’ • Seconds – there are 60 seconds in each minute • The symbol for seconds is ”
Longitude • Longitude lines run north and south and meet at the poles. • They are also known as meridians • The prime meridian, which passes through Greenwich, England, was selected to be 0 • The meridian halfway around the world from the prime meridian is 180 • All locations east of the prime meridian have longitudes between 0 and 180 E • All locations west of the prime meridian have longitudes between 0 and 180 W
Longitude • Can also be further divided into minutes and seconds • For meridians, the distance of a degree depends on location • At the equator, a degree is ~111 km • Since all meridians meet at the poles, the distance measured by a degree of longitude decreases when moving from the equator to the poles • Ex: at a latitude of 60 N, 1 degree of longitude equals ~55 km
Great Circles • A circle that divides the globe into equal halves • Any circle formed by two meridians of longitude that are directly opposite each other is a great circle • The equator is the only line of latitude that is a great circle • Great circles are often used for navigation • They are the shortest distance between two points on a sphere
Magnetic Declination • The earth has geographic poles and geomagnetic poles, which are different from each other • A compass points to the geomagnetic north pole • The angle between the direction of the geographic north pole and geomagnetic north pole is called the magnetic declination • It is measured in degrees east or west of the geographic north pole
Magnetic Declination • Magnetic declination varies according to where you are on Earth • A compass can be set with the declination for a specific area so that it points to geographic north
Reading a Map • To read a map, you must be able to find directions, calculate distances and understand the symbols
Map Directions • The cardinal directions (N, S, E & W) are marked by a compass rose, or by a north arrow
Map Directions • Direction is determined in relation to parallels and meridians • Parallels (latitude) and meridians (longitude) are labeled in degrees, minutes and seconds
Map Symbols • Features on a map are represented by symbols • These symbols are explained on the map legend
Map Scales • In order to be accurate, a map must be drawn to scale • Map scale indicates the relationship between distance on the map and actual distance • Three types: • Graphic scale • Fractional scale • Verbal scale
Graphic Scale • A printed line with markings similar to those on a ruler • The line represents a certain distance, such as a mile or kilometer, and may be broken down into smaller segments
Fractional Scale • Expresses distance as a ratio • Ex: a scale of 1:25,000 indicates that 1 unit of distance on the map represents 25,000 of the same unit on Earth • The larger the ratio of the map, the less detail is shown
Verbal Scale • Expresses scale in sentence form • Ex: 1 cm on the map is equal to 1 km on earth
Types of Maps • There are many different types of maps • Examples of maps used in geology include, but are not limited to: • Geologic maps • Geologic cross sections • Topographic maps
Geologic Maps • Show the rocks and geologic features that are exposed at the surface
Geologic Cross Sections Diagrams that show the features that would be visible if vertical slices were made through part of the crust Shows the rocks and structures (e.g., faults and folds) under Earth’s surface
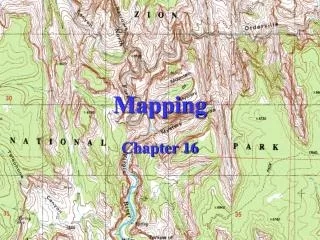
Topographic Maps • Show the topography of a given area • Topography – the elevation, change in elevation and shape of a region • Elevation is the distance above, or below, sea level
Contour Lines • Elevation is represented by contour lines • They connect points of equal elevation • The shape of the contour lines reflects the shape of the land • Contour lines never cross (if they did, the point where they crossed would have two elevations)
Contour Interval & Index Contours • Contour interval - the difference in elevation between one contour line and the next • Index contours - every fifth contour line on a map is made darker and marked with the elevation • This makes the map less cluttered and easier to read • Exact elevations, such as a mountain peak, are marked by an x and labeled with the elevation
Landforms on Topographic Maps • The shape and spacing of contour lines show the shapes of the landforms represented on the map • Widely spaced contour lines indicate a gradual change in elevation • Closely spaced contour lines indicate terrain that is steep, such as a mountain slope
Landforms on Topographic Maps Closed contour lines (loop shaped) indicate hills or peaks Depressions, such as volcanic craters, are marked by hachures –short, perpendicular lines inside a closed contour loop V shaped contours indicate a valley, and they always point upstream.