Download

1 / 12
140 likes | 273 Views
Explore the method of ANOVA to test if three or more population means are equal by analyzing variances. Learn about requirements, hypothesis testing, decision-making based on p-value, and the relationship to F-Test Statistic and P-Value.

E N D
Preview • Analysis of variance (ANOVA) is a method for testing the hypothesis that three or more population means are equal. • For example: • At least one mean is different
One-Way ANOVA We draw conclusions from the p-value: If the p-value is high (P > 0.05), the means appear to all be equal (fail to reject H0) If the p-value is low (P < 0.05), at least one of the means does not appear to equal the others (reject H0) If the P is high, let H0 fly! If the P is low, let H0 go!
Just like when we compared two independent means in Ch. 9.3 1. Not symmetric (skewed to the right) 2. Only uses 0 and positive values. 3. Depends on two degrees of freedom: df1 df2 ANOVA Methods Require the F-Distribution
Definition One-way analysis of variance (ANOVA) is a method of testing the equality of three or more population means by analyzing sample variances. One-way analysis of variance is used with data categorized with one treatment (or factor), which is a characteristic that allows us to distinguish the different populations from one another.
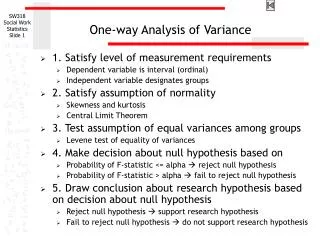
One-Way ANOVA Requirements 1. The populations have approximately normal distributions. 2. The populations have the same variance (or standard deviation ). 3. The samples are simple random samples. 4. The samples are independent of each other. 5. The different samples are from populations that are categorized in only one way.
Conducting a test about 3 or more means The null and alternative hypothesis always looks like: H0: µ1 = µ2 = µ3 = … H1: At least one of the means is different Enter data in StatCrunch and perform a one-way ANOVA test. Using the resulting p-value, make an initial and final conclusion: If p-value > α : fail to reject H0”If p-value > α : reject H0
Caution When we conclude that there is sufficient evidence to reject the claim of equal population means, we cannot conclude from ANOVA that any particular mean is different from the others. (however, one can make an “educated guess” based on means of each sample)
Example 1: Use the chest deceleration measurements listed in Table 12-1 and a 0.05 significance to test the claim that the three samples come from populations with means that are all equal.
Example 1: α = 0.05 H0: µ1 = µ2 = µ3 H1: At least one of the means is different Enter data in StatCrunch and (see tutorial video)Stat – ANOVA – One way From this: p-value = 0.028 (less than α) Thus, since we reject H0, at least one of the population means appears to be different
Test Statistic for One-Way ANOVA It can be thought of as the total relative variation of values between each sample. If population means are the same, this relative variance should be low (since the values will be close to their means). If at least on of the means different, the relative variance will be large (since at least one of the samples will have values significantly different from the others).