Download
1 / 17
170 likes | 3.04k Views
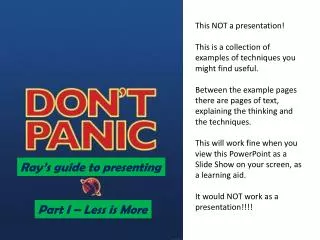
This NOT a presentation! This is a collection of examples of techniques you might find useful. Between the example pages there are pages of text, explaining the thinking and the techniques. This will work fine when you view this PowerPoint as a Slide Show on your screen, as a learning aid.

E N D
This NOT a presentation! This is a collection of examples of techniques you might find useful. Between the example pages there are pages of text, explaining the thinking and the techniques. This will work fine when you view this PowerPoint as a Slide Show on your screen, as a learning aid. It would NOT work as a presentation!!!! Ray’s guide to presenting Part I – Less is More
The presentation is you! What you say, how you say it, and your body language when saying it, create the message. If you are using slideware (e.g. PowerPoint or Keynote), the slides are there to help you say what you need to say. The slides are not the presentation. You are the presentation.
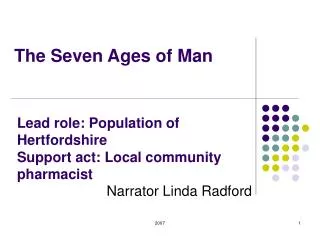
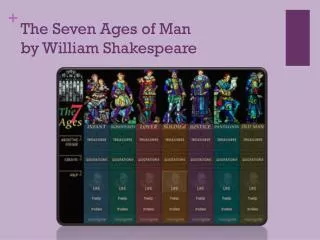
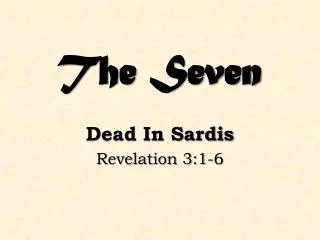
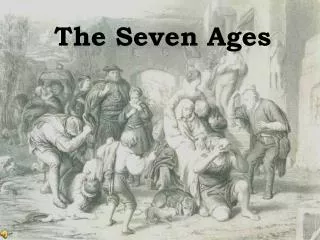
For example, You want to talk about Shakespeare's 7 Ages of Man
Comment: At any one moment,the speaker will betalking about justone point. The other points are simply a distraction. They are an invitation to the audience to read ahead or to review an earlier point. The next slide illustrates an alternative. The Seven Ages of Man • Infant • Schoolboy • Lover • Soldier • Justice • Pantaloon • Second childhood From Shakespeare’s As You Like it, soliloquy by Jacques
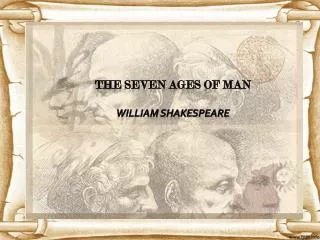
The Seven Ages of Man Infant Schoolboy Lover Soldier Justice Pantaloon Second childhood
Technical Notes re Previous Page: All the builds and effects on the previousslide were achieved via custom animation Picture dimmed via Emphasis The Seven Age is set to build “with previous”, and Effect Option “Hide on next Mouse Click” Infant to Pantaloon animated on click, and Effect Option “Hide on next Mouse Click” Second childhood animated on click, with the default Effect Option “Don’t Dim”
When to use bullets: In general bullets are not helpful, particularlywhen items are shown one at a time. However, there are cases where bullets or numbered lists can be useful. On the next slide I look at Isaac Asimov's Three Laws of Robotics. Whilst I want the three laws to appear one at a time, I am also aware that the later laws refer to the earlier laws. It would be a bit harsh to expect the audience to have memorised them. So, I use the Effect Option ‘Dim’ to keep them on the screen, but at the same time remove the audiences focus from them. And since these laws are referred to as 1, 2, and 3, it makes sense to use numbered bullets.
Three Laws of Robotics A robot may not injure a human being or, through inaction, allow a human being to come to harm A robot must obey orders given it by human beings except where such orders would conflict with the First Law A robot must protect its own existence as long as such protection does not conflict with the First or Second Law
Charts and Graphs: • On the chart on the next page the key story isthat the data suggest that people in Manchester either: • Drank more alcohol the previous weekend • Claimed to have drunk more • The problem most charts (and this is a pretty simple example) is that there is too much information. The speaker needs to guide the audience through the chart in order to convey the insight. • The second chart uses PowerPoint’s built in animation to build the chart one piece at a time.
Structural Equation Model: The next slide looks at a more complicatedexample, based on using Structural Equation Modelling.The piecemeal development of the chart allowsthe presenter to take the audience with him/her. For example, telling the audience that boxes represent values that can be measured. Implicit or Latent variables cannot be measured and shown via ovals. The presenter can look at the faces when presenting and ensure that everyone understands. Relationships are shown by lines, with loadings shown on the lines.
SEM Model of Hotel Satisfaction Performance Queue .54 Front Desk .66 Greet Recommend .74 .68 .49 Polite People .29 .42 .49 Wait Waitress .62 Overall Satisfaction .59 Correct .37 .52 Meeting Space Temp .62 .54 Revisit .55 .37 .42 Space Facilities View .13 .61 Room .67 Clean Price
Using the Less is More style: Most people find that it takes longer to presentmaterial in this way. But, audiences seem to prefer it, and they understand more. So, you mayneed to cut your material back, in order topresent it more clearly. One challenge for the presenter is that there are fewer cues on the page. If you show all the bullets in one go, you know what is coming up, and it is easier to avoid talking about things at the wrong time. The Less is More style requires more rehearsing, and it requires the presenter to have more items committed to either their memory or their notes. It may be the main benefit of the Less is More style is that it makes encourages the presenter to prepare more thoroughly.
That’s it for now But there will be more Let me know your thoughts Ray.poynter@thefutureplace.com http://thefutureplace.typepad.com/