Resistivity Results
The Spring 2013 resistivity study in Schurz, NV, reveals significant geological insights through varying models: Q-type (decreasing resistivity with depth), A-type (increasing resistivity), H-type (low resistivity in layer 2), and K-type (high resistivity in layer 2). Profiles indicate a shallow high-resistivity layer (

Resistivity Results
E N D
Presentation Transcript
Resistivity Results GPH 492 Spring 2013 Schurz, NV
Field Map Box 1 Box 2 Box 3
Model Types Q-type: Decreasing apparent resistivity with depth A-type: Increasing apparent resistivity with depth H-type: Layer 2 apparent resistivity is less than layer 1 and layer 3 K-type: Layer 2 apparent resistivity is greater than layer 2 and layer 3
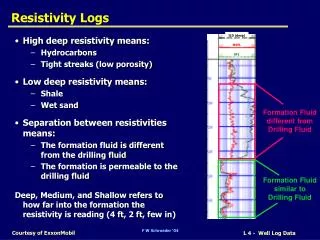
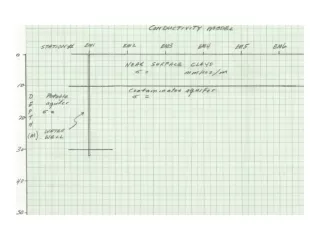
Box 2 • Most profiles yield shallow high resistivity layer at the surface of less than 2 m • Low resistivity layer at depth ranges from 4.5 to 40 m • Range of imaginary component values is 0.01 to 0.33 ohms • Depth of confidence of arrays: 20 meters
Box 3, all arrays parallel to fault trace -all arrays (except 8 and 10) showed a thin low resistivity layer at a shallow depth -Depth of the 1st layer varied from ½ - 2 m, with one plot reaching 6.4 m, resistivity varied from 161 – 319 ohm-m. -All arrays were H or K-type models, 2 arrays could not be modeled with a RMS values less than 100. -The depth of confidence was between 1-3 m, this is probably too shallow to see a fault
Sources of error • Metal spiked rod electrodes not completely grounded • Electrodes not placed at exact A-spacing values • Sand and Clay layers in Box 3 • Open line in array; electrodes moved perpendicular from array
Conclusions • We believe we found a low-resistivity anomaly at depth indicating possible location of fault in Box 1 • Box 2 and 3 did not exhibit similar anomaly as in Box 1 • May have missed the fault trace in Box 2