Manufacturing Variation
Learn how to plot a normal distribution to analyze variation in manufacturing processes. See how most values cluster around the mean with some deviations. Understand standard deviation and data percentage within certain ranges. Create a histogram in Excel to visualize the distribution.

Manufacturing Variation
E N D
Presentation Transcript
Manufacturing Variation Plotting a Normal Distribution
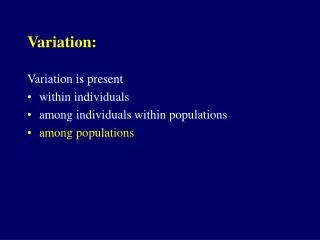
Variation is inherent • Plotting variation gives a Normal distribution or Gaussian distribution or Bell Curve
Normal distribution • Most values are clustered around the Mean • Some values are deviated: spread out. Measure of this deviation is a number called Standard Deviation . • 68 % of data are within 1 • 95 % of data points are within 2 • 99.7 % of data points are within 3
Histogram in Excel • Prepare the “bin” range: divide data into buckets. • Add-in the Data analysis and select Histogram • Select the input data, bin data and output column • Format plot according to writing guidelines. • Find average and Standard Deviation of data. • Submit a Memo for the above.