Download
1 / 60
670 likes | 1.21k Views
C H A P T E R 11. Pricing with Market Power. CHAPTER OUTLINE. 11.1 Capturing Consumer Surplus 11.2 Price Discrimination 11.3 Intertemporal Price Discrimination and Peak-Load Pricing 11.4 The Two-Part Tariff 11.5 Bundling 11.6 Advertising Appendix: The Vertically Integrated Firm.

E N D
C H A P T E R 11 Pricing with Market Power CHAPTER OUTLINE 11.1Capturing Consumer Surplus 11.2Price Discrimination 11.3Intertemporal Price Discrimination and Peak-Load Pricing 11.4The Two-Part Tariff 11.5Bundling 11.6Advertising Appendix: The Vertically Integrated Firm Prepared by: Fernando Quijano, Illustrator
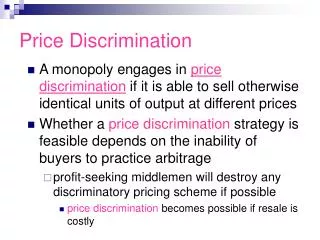
11.1 Capturing Consumer Surplus FIGURE 11.1 CAPTURING CONSUMER SURPLUS If a firm can charge only one price for all its customers, that price will be P* and the quantity produced will be Q*. Ideally, the firm would like to charge a higher price to consumers willing to pay more than P*, thereby capturing some of the consumer surplus under region A of the demand curve. The firm would also like to sell to consumers willing to pay prices lower than P*, but only if doing so does not entail lowering the price to other consumers. In that way, the firm could also capture some of the surplus under region B of the demand curve. ●price discrimination Practice of charging different prices to different consumers for similar goods.
11.2 Price Discrimination First-Degree Price Discrimination ●reservation price Maximum price that a customer is willing to payfor a good. ●first degree price discrimination Practice of charging each customer her reservation price. ●variable profit Sum of profits on each incremental unit produced by a firm; i.e., profit ignoring fixed costs.
FIGURE 11.2 ADDITIONAL PROFIT FROM PERFECT FIRST-DEGREE PRICE DISCRIMINATION Because the firm charges each consumer her reservation price, it is profitable to expand output to Q**. When only a single price, P*, is charged, the firm’s variable profit is the area between the marginal revenue and marginal cost curves. With perfect price discrimination, this profit expands to the area between the demand curve and the marginal cost curve.
PERFECT PRICE DISCRIMINATION The additional profit from producing and selling an incremental unit is the difference between demand and marginal cost. IMPERFECT PRICE DISCRIMINATION FIGURE 11.3 FIRST-DEGREE PRICE DISCRIMINATION IN PRACTICE Firms usually don’t know the reservation price of every consumer, but sometimes reservation prices can be roughly identified. Here, six different prices are charged. The firm earns higher profits, but some consumers may also benefit. With a single price P4, there are fewer consumers. The consumers who now pay P5 or P6 enjoy a surplus.
Second-Degree Price Discrimination ●second-degree price discrimination Practice of charging different prices per unit for different quantities of the same good or service. ●block pricing Practice of charging different prices for different quantities or “blocks” of a good. FIGURE 11.4 SECOND-DEGREE PRICE DISCRIMINATION Different prices are charged for different quantities, or “blocks,” of the same good. Here, there are three blocks, with corresponding prices P1, P2, and P3. There are also economies of scale, and average and marginal costs are declining. Second-degree price discrimination can then make consumers better off by expanding output and lowering cost.
Third-Degree Price Discrimination ●third-degree price discrimination Practice of dividing consumers into two or more groups with separate demand curves and charging different prices to each group. CREATING CONSUMER GROUPS If third-degree price discrimination is feasible, how should the firm decide what price to charge each group of consumers? We know that however much is produced, total output should be divided between the groups of customers so that marginal revenues for each group are equal. We know that total output must be such that the marginal revenue for eachgroup of consumers is equal to the marginal cost of production.
Let P1 be the price charged to the first group of consumers, P2 theprice charged to the second group, and C(QT) the total cost ofproducing output QT = Q1 + Q2. Total profit is then (11.1) DETERMINING RELATIVE PRICES (11.2)
FIGURE 11.5 THIRD-DEGREE PRICE DISCRIMINATION Consumers are divided into two groups, with separate demand curves for each group. The optimal prices and quantities are such that the marginal revenue from each group is the same and equal to marginal cost. Here group 1, with demand curve D1, is charged P1, and group 2, with the more elastic demand curve D2, is charged the lower price P2. Marginal cost depends on the total quantity produced QT. Note that Q1 and Q2 are chosen so that MR1 = MR2 = MC.
FIGURE 11.6 NO SALES TO SMALLER MARKETS Even if third-degree price discrimination is feasible, it may not pay to sell to both groups of consumers if marginal cost is rising. Here the first group of consumers, with demand D1, are not willing to pay much for the product. It is unprofitable to sell to them because the price would have to be too low to compensate for the resulting increase in marginal cost.
EXAMPLE 11.1 THE ECONOMICS OF COUPONS AND REBATES Coupons provide a means of price discrimination.
AIRLINE FARES EXAMPLE 11.2 Travelers are often amazed at the variety of fares available for round-trip flights from New York to Los Angeles. Recently, for example, the first-class fare was above $2000; the regular (unrestricted) economy fare was about $1000, and special discount fares (often requiring the purchase of a ticket two weeks in advance and/or a Saturday night stayover) could be bought for as little as $200. These fares provide a profitable form of price discrimination. The gains from discriminating are large because different types of customers, with very different elasticities of demand, purchase these different types of tickets. Airline price discrimination has become increasingly sophisticated. A wide variety of fares is available.
11.3 Intertemporal Price Discriminationand Peak-Load Pricing ●intertemporal price discrimination Spending money in socially unproductive efforts to acquire, maintain, or exercise monopoly. ●peak-load pricing Spending money in socially unproductive efforts to acquire, maintain, or exercise monopoly. Intertemporal Price Discrimination FIGURE 11.7 INTERTEMPORAL PRICE DISCRIMINATION Consumers are divided into groups by changing the price over time. Initially, the price is high. The firm captures surplus from consumers who have a high demand for the good and who are unwilling to wait to buy it. Later the price is reduced to appeal to the mass market.
Peak-Load Pricing FIGURE 11.8 PEAK-LOAD PRICING Demands for some goods and services increase sharply during particular times of the day or year. Charging a higher price P1 during the peak periods is more profitable for the firm than charging a single price at all times. It is also more efficient because marginal cost is higher during peak periods.
HOW TO PRICE A BEST-SELLING NOVEL EXAMPLE 11.3 Publishing both hardbound and paperbackeditions of a book allows publishers to pricediscriminate. Some consumers want to buy a new bestselleras soon as it is released, even if the price is $25.Other consumers, however, will wait a year untilthe book is available in paperback for $10. The key is to divide consumers into two groups, so that those who are willing to pay a high price do so and only those unwilling to pay a high price wait and buy the paperback. It is clear, however, that those consumers willing to wait for the paperback edition have demands that are far more elastic than those of bibliophiles. It is not surprising, then, that paperback editions sell for so much less than hardbacks.
11.4 The Two-Part Tariff ●two-part tariff Form of pricing in which consumers are charged both an entry and a usage fee. SINGLE CONSUMER FIGURE 11.9 TWO-PART TARIFF WITH A SINGLE CONSUMER The consumer has demand curve D. The firm maximizes profit by setting usage fee P equal to marginal cost and entry fee T* equal to the entire surplus of the consumer.
TWO CONSUMERS FIGURE 11.10 TWO-PART TARIFF WITH TWO CONSUMERS The profit-maximizing usage fee P* will exceed marginal cost. The entry fee T* is equal to the surplus of the consumer with the smaller demand. The resulting profit is 2T* + (P* − MC)(Q1 + Q2). Note that this profit is larger than twice the area of triangle ABC.
MANY CONSUMERS FIGURE 11.11 TWO-PART TARIFF WITH MANY DIFFERENT CONSUMERS Total profit π is the sum of the profit from the entry fee πa and the profit from sales πs. Both πa and πs depend on T, the entry fee. Therefore π = πa + πs = n(T)T + (P − MC)Q(n) where n is the number of entrants, which depends on the entry fee T, and Q is the rate of sales, which is greater the larger is n. Here T* is the profit-maximizing entry fee, given P. To calculate optimum values for P and T, we can start with a number for P, find the optimum T, and then estimate the resulting profit. P is then changed and the corresponding T recalculated, along with the new profit level.
PRICING CELLULAR PHONE SERVICE EXAMPLE 11.4 Most telephone service is priced using a two-part tariff:a monthly access fee, which may include some freeminutes, plus a per-minute charge for additionalminutes. This is also true for cellular phone service, which has grown explosively, both in the United Statesand around the world. In the case of cellular service, providers have taken thetwo-part tariff and turned it into an art form. In most parts of the United States, consumers can choose among four national network providers—Verizon, T-Mobile, AT&T, and Sprint. These providers compete among themselves for customers, but each has some market power. Market power arises in part from oligopolistic pricing and output decisions, but also because consumers face switching costs: Most service providers impose a penalty upwards of $200 for early termination. Because providers have market power, they must think carefully about profit-maximizing pricing strategies. The two-part tariff provides an ideal means by which cellular providers can capture consumer surplus and turn it into profit. The two-part tariff works best when consumers have identical or very similar demands.
PRICING CELLULAR PHONE SERVICE EXAMPLE 11.4
PRICING CELLULAR PHONE SERVICE EXAMPLE 11.4
11.5 Bundling ●bundling Practice of selling two or more products as a package. To see how a film company can use customer heterogeneity to its advantage, suppose that there are two movie theaters and that their reservation prices for our two films are as follows: If the films are rented separately, the maximum price that could be charged for Wind is $10,000 because charging more would exclude Theater B. Similarly, the maximum price that could be charged for Gertie is $3000. But suppose the films are bundled. Theater A values the pair of films at $15,000 ($12,000 + $3000), and Theater B values the pair at $14,000($10,000 + $4000). Therefore, we can charge each theater $14,000 for the pair of films and earn a total revenue of $28,000.
Relative Valuations Why is bundling more profitable than selling the films separately? Because the relative valuations of the two films are reversed. The demands are negatively correlated—the customer willing to pay the most for Wind is willing to pay the least for Gertie. Suppose demands were positively correlated—that is, Theater A would pay more for both films: If we bundled the films, the maximum price that could be charged for the package is $13,000, yielding a total revenue of $26,000, the same as by renting the films separately.
FIGURE 11.12 RESERVATION PRICES Reservation prices r1 and r2 for two goods are shown for three consumers, labeled A, B, and C. Consumer A is willing to pay up to $3.25 for good 1 and up to $6 for good 2.
FIGURE 11.13 CONSUMPTION DECISIONS WHEN PRODUCTS ARE SOLD SEPARATELY The reservation prices of consumers in region I exceed the prices P1 and P2 for the two goods, so these consumers buy both goods. Consumers in regions II and IV buy only one of the goods, and consumers in region III buy neither good.
FIGURE 11.14 CONSUMPTION DECISIONS WHEN PRODUCTS ARE BUNDLED Consumers compare the sum of their reservation prices r1+ r2, with the price of the bundle PB. They buy the bundle only if r1 + r2 is at least as large as PB.
FIGURE 11.15 RESERVATION PRICES In (a), because demands are perfectly positively correlated, the firm does not gain by bundling: It would earn the same profit by selling the goods separately. In (b), demands are perfectly negatively correlated. Bundling is the ideal strategy—all the consumer surplus can be extracted.
FIGURE 11.16 MOVIE EXAMPLE Consumers A and B are two movie theaters. The diagram shows their reservation prices for the films Gone with the Wind and Getting Gertie’s Garter. Because the demands are negatively correlated, bundling pays.
Mixed Bundling ●mixed bundling Selling two or more goods both as a package and individually. ●pure bundling Selling products only as a package. FIGURE 11.17 MIXED VERSUS PURE BUNDLING With positive marginal costs, mixed bundling may be more profitable than pure bundling. Consumer A has a reservation price for good 1 that is below marginal cost c1, and consumer D has a reservation price for good 2 that is below marginal cost c2. With mixed bundling, consumer A is induced to buy only good 2, and consumer D is induced to buy only good 1, thus reducing the firm’s cost.
Let’s compare three strategies: 1. Selling the goods separately at prices P1 = $50 and P2 = $90. 2. Selling the goods only as a bundle at a price of $100. 3. Mixed bundling, whereby the goods are offered separately at prices P1 = P2 = $89.95, or as a bundle at a price of $100. As we should expect, pure bundling is better than selling the goods separately because consumers’ demands are negatively correlated. But what about mixed bundling?
FIGURE 11.18 MIXED BUNDLING WITH ZERO MARGINAL COSTS If marginal costs are zero, and if consumers’ demands are not perfectly negatively correlated, mixed bundling is still more profitable than pure bundling. In this example, consumers B and C are willing to pay $20 more for the bundle than are consumers A and D. With pure bundling, the price of the bundle is $100. With mixed bundling, the price of the bundle can be increased to $120 and consumers A and D can still be charged $90 for a single good.
Bundling in Practice FIGURE 11.19 MIXED BUNDLING IN PRACTICE The dots in this figure are estimates of reservation prices for a representative sample of consumers. A company could first choose a price for the bundle, PB, such that a diagonal line connecting these prices passes roughly midway through the dots. The company could then try individual prices P1 and P2. Given P1, P2, and PB, profits can be calculated for this sample of consumers. Managers can then raise or lower P1, P2, and PB and see whether the new pricing leads to higher profits. This procedure is repeated until total profit is roughly maximized.
THE COMPLETE DINNER VERSUS À LA CARTE: A RESTAURANT PRICING PROBLEM EXAMPLE 11.5 For a restaurant, mixed bundling means offeringboth complete dinners (the appetizer, maincourse, and dessert come as a package) andan à la carte menu (the customer buys theappetizer, main course, and dessert separately). This strategy allows the à la carte menu to bepriced to capture consumer surplus from customers who value some dishes much more highly than others. At the same time, the complete dinner retains those customers who have lower variations in their reservation prices for different dishes (e.g., customers who attach moderate values to both appetizers and desserts).
EXAMPLE 11.5 THE COMPLETE DINNER VERSUS À LA CARTE: A RESTAURANT PRICING PROBLEM For a restaurant, mixed bundling means offering complete dinners and an à la carte menu. This strategy allows the à la carte menu to be priced to capture consumer surplus from customers who value some dishes much more highly than others. Successful restaurateurs know their customers’ demand characteristics and use that knowledge to design a pricing strategy that extracts as much consumer surplus as possible.
Tying ●tying Practice of requiring a customer to purchase one good in order to purchase another. Why might firms use this kind of pricing practice? One of the main benefits of tying is that it often allows a firm to meter demand and thereby practice price discrimination more effectively. Tying can also be used to extend a firm’s market power. Tying can have other uses. An important one is to protect customer goodwill connected with a brand name. This is why franchises are often required to purchase inputs from the franchiser.
11.6 Advertising FIGURE 11.20 EFFECTS OF ADVERTISING AR and MR are average and marginal revenue when the firm doesn’t advertise, and AC and MC are average and marginal cost. The firm produces Q0 and receives a price P0. Its total profit π0 is given by the gray-shaded rectangle. If the firm advertises, its average and marginal revenue curves shift to the right. Average cost rises (to AC′) but marginal cost remains the same. The firm now produces Q1 (where MR′ = MC), and receives a price P1. Its total profit, π1, is now larger.
The price P and advertising expenditure A to maximize profit, is given by: Advertising leads to increased output. But increased output in turn means increased production costs, and this must be taken into account when comparing the costs and benefits of an extra dollar of advertising. The firm should advertise up to the point that (11.3) =full marginal cost of advertising
A Rule of Thumb for Advertising First, rewrite equation (11.3) as follows: Now multiply both sides of this equation by A/PQ, the advertising-to-sales ratio. ● advertising-to-sales ratio Ratio of a firm’s advertising expenditures to its sales. ● advertising elasticity of demand Percentage change in quantity demanded resulting from a 1-percent increase in advertising expenditures. (11.4)
ADVERTISING IN PRACTICE EXAMPLE 11.6 Convenience stores have lower price elasticities ofdemand (around −5), but their advertising-to-salesratios are usually less than those for supermarkets(and are often zero). Why? Because convenience stores mostly serve customers who live nearby; they may need a few items late at night or may simply not want to drive to the supermarket. Advertising is quite important for makers of designer jeans, who will have advertising-to-sales ratios as high as 10 or 20 percent. Laundry detergents have among the highest advertising-to-sales ratios of all products, sometimes exceeding 30 percent, even though demand for any one brand is at least as price elastic as it is for designer jeans. What justifies all the advertising? A very large advertising elasticity.
ADVERTISING IN PRACTICE EXAMPLE 11.6
ADVERTISING IN PRACTICE EXAMPLE 11.6
Appendix to Chapter 11 The Vertically Integrated Firm ● horizontal integration Organizational form in which several plants produce the same or related products for a firm. ● vertical integration Organizational form in which a firm contains several divisions, with some producing parts and components that others use to produce finished products. ● transfer prices Internal prices at which parts and components from upstream divisions are “sold” to downstream divisions within a firm..
Why Vertically Integrate? Market Power and Double Marginalization How do firms along a vertical chain exercise such monopoly power, and how are prices and output affected? Would the firms benefit from a vertical merger that integrates an upstream and a related downstream business? Would consumers? Suppose an engine manufacturer has monopoly power in the market for engines, and an automobile manufacturer that buys these engines has monopoly power in the market for its cars. Would this market power cause these two firms to benefit in any way if they were to merge? Would consumers of the final product—automobiles—be better or worse off if the two companies merged? When there is market power of this sort, a vertical merger can be beneficial to the two firms, and also beneficial to consumers.
SEPARATE FIRMS Suppose a monopolist producer of specialty engines produces those engines at a constant marginal cost cE, and sells the engines at a price PE. The engines are bought by a monopolist producer of sports cars, which sells the cars at the price P. Demand for the cars is given by with the constant A > cE. (A11.3) (A11.1) (A11.2) If the two companies are independent of each other, the automobile manufacturer will take the price of engines as given, and choose a price for its cars to maximize its profits: You can check that given PE, the profit maximizing price of cars is:
SEPARATE FIRMS Then the number of cars sold and the automobile company’s profit are: and (A11.5) (A11.4) What about the engine manufacturer? It chooses the price of engines, PE, to maximize its profit: (A11.6)
You can confirm that the profit-maximizing price of engines is: (A11.7) The profit to the engine manufacturer is then equal to: (A11.8) In Equation (A11.5), substitute for the price of engines from equation (A11.7) . You will see that the automobile company’s profit is then: (A11.9) Hence the total profit for the two companies is: (A11.10) Also, the price paid by consumers is: (A11.11)
VERTICAL INTEGRATION Now suppose that the engine company and the automobile company merge to form a vertically integrated firm. The management of this firm would choose a price of automobiles to maximize the firm’s profit: (A11.12) The profit-maximizing price of cars is now: (A11.13) which yields a profit of: (A11.14) Observe that the profit for the integrated firm is greater than the total profit for the two individual firms that operate independently. Furthermore, the price to consumers for automobiles is lower. DOUBLE MARGINALIZATION ● double marginalization When each firm in a vertical chain marks up its price above its marginal cost, thereby increasing the price of the final product.
FIGURE A11.1 (1 of 2) EXAMPLE OF DOUBLE MARGINALIZATION For the automobile company, the marginal revenue curve for cars is the demand curve for engines (the net marginal revenue for engines). Corresponding to that demand curve is the engine company’s marginal revenue curve, MRE. If the engine company and automobile company are separate entities, the engine company will produce a quantity of engines Q ′Eat the point where its marginal revenue curve intersects its marginal cost curve. The automobile maker will buy those engines and produce an equal number of cars. Hence, the price of cars will be P ′A.
FIGURE A11.1 (2 of 2) EXAMPLE OF DOUBLE MARGINALIZATION But if the firms merge, the integrated company will have the demand curve ARCARS and marginal revenue curve MRCARS. It produces a number of engines and equal number of cars at the point where MRCARS equals the marginal cost of producing cars, which is MCE. Thus more engines and cars are produced, and the price of cars is lower. ALTERNATIVES TO VERTICAL INTEGRATION ● quantity forcing Use of a sales quota or other incentives to make downstream firms sell as much as possible.
Transfer Pricing in the Integrated Firm Transfer Pricing When There Is No Outside Market Suppose the downstream automobile division had to “pay” the upstream engine division a transfer price for each engine it used. What should that transfer price be? It should equal the marginal cost of producing engines, i.e., MCE. Why? Because then the automobile division will have a marginal cost of producing cars equal to MCE, so that even if it is left to maximize its own divisional profit, it will produce the correct number of cars. Another way to see this is in terms of opportunity cost. The opportunity cost to the integrated firm of utilizing one more engine is the marginal cost of engines. Thus we have a simple rule: Set the transfer price of any upstream parts and components equal to the marginal cost of producing those parts and components. Now consider a firm with three divisions: Two upstream divisions produce inputs to a downstream processing division. The two upstream divisions produce quantities Q1and Q2 and have total costs C1(Q1) and C2(Q2). The downstream division produces a quantity Q using the production function