Download
1 / 35
390 likes | 638 Views
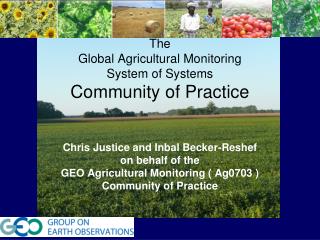
GEOGLAM: The Global Agricultural Monitoring Initiative. Chris Justice & Inbal Becker-Reshef on behalf of the GEO Agricultural Monitoring Community of Practice. GEO Agriculture Monitoring Community of Practice an open community of Data Providers, Brokers and Information Users.

E N D
GEOGLAM: The Global Agricultural Monitoring Initiative Chris Justice& Inbal Becker-Reshef on behalf of the GEO Agricultural Monitoring Community of Practice
GEO Agriculture Monitoring Community of Practicean open community of Data Providers, Brokers and Information Users Initiated under the GEO Agricultural Monitoring Task in 2007 and now focused on GEOGLAM
Context for GEOGLAM Monthly Wheat Prices 1960-2011($/Metric Ton)Source: World Bank 2008 Price hikes Droughts: Australia & Ukraine NASA/USDA/NOAA AGRISTARS 2010/11 Price hikes Drought: Russia 1971/2’s price hike Drought: Russia Landsat 1 Launched (1972) Nominal wheat price in US $/metric Ton
Policy Framework for GEOGLAM • The G20 Cannes Summit (November 2011) Action Plan on Food Price Volatility and Agriculture • Reaffirmed GEOGLAM commitment at the 2012 G-20 Los Cabos Declaration & in Agriculture Ministers Report
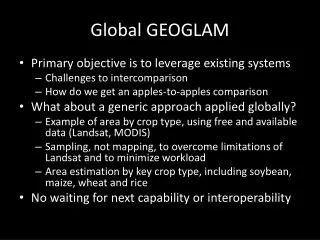
G20 GEOGLAM Goal: To strengthen the international community’s capacity to produce and disseminate relevant, timely and accurate forecasts of agricultural production at national, regional and global scales through the use of EO Outcome: an improved and more harmonized systems of systems taking advantage of new satellite assets and methods and a higher level of international coordination • GEOGLAM is implemented in the framework of GEO
Why This Matters: Looking Forward Agriculture Faces Major Challenges in this Century • Increasing pressures on agricultural land and production from: • Increased severe weather events and climate change • Population growth & changing diets • Fuel vs. Food vs. Feed • Limited water and suitable arable land • Higher price volatility for major grains • Commodity markets are increasingly linked (good and bad) • Rising fuel prices impact food prices (transport, fertilizer) • NEED TO INCREASE GLOBAL PRODUCTION BY 70% BY 2050 TO MEET DEMAND (FAO) Data and tools for monitoring and reliably forecasting production are essential for anticipating market imbalances and enhancing policy responses
Why This Matters: Looking Forward Agriculture Faces Major Challenges in this Century • Increasing pressures on agricultural land and production from: • Increased severe weather events and climate change • Population growth & changing diets • Fuel vs. Food vs. Feed • Limited water and suitable arable land • Higher price volatility for major grains • Commodity markets are increasingly linked (good and bad) • Rising fuel prices impact food prices (transport, fertilizer) • NEED TO INCREASE GLOBAL PRODUCTION BY 70% BY 2050 TO MEET DEMAND (FAO) Data and tools for monitoring and reliably forecasting production are essential for anticipating market imbalances and enhancing policy responses
4. EO DATA COORDINATION 5. METHOD IMPROVEMENT through R&D coordination (JECAM) 6. Data, products and INFORMATION DISSEMINATION GEOGLAM Components Stakeholders Governments AMIS FAO The 26th CEOS Plenary – Bengaluru, India - 24-27 October, 2012
Organization and Roles • Steering Committee • Stakeholder Program Steering and Donor Coordination • Program Coordinator (Secretariat at the GEOSec) • Program coordination, fund raising and management, program reporting and outreach • Chair of Implementation Committee • Ex Officio member of the Steering Committee • Implementation Committee • Coordination across Implementation Teams • Reporting to and discussion with the SC on progress and future developments • Coordination with AMIS and other Partner programs • Implementation Teams • representation from the individual project/ activities • Projects w. Project Leads • projects contributing to meeting the GEOGLAM goals
GEOGLAM phased implementation across all components • Phase 0 (P0) 2011-2013 Foundation Activities • Phase 1 (P1) 2013-2015 Demonstration & Early Feasibility • Build on existing activities • Initiate Pilot Projects • Phase 2 (P2) 2014 – 2016 Review and Expansion • Continue/Complete Phase 1 Activities • New Starts • Phase 3 (P3) 2015- 2017 Pre-Operational • Completion of Phase 1 / 2 Projects • Geographic Expansion • Operational Phase 2017 >
GEOGLAM Demonstration & Early Feasibility Phase 0 > Phase 1Examples by Component
Component 1 Crop Condition Global Outlook: Building International Consensus Assessment of Crop Conditions in Northern Hemisphere- input to AMIS Canada Russia Ukraine Kazakhstan Russia, Orenburg USA Spring Wheat Spring Wheat Spring Wheat Winter Wheat/ Corn Corn/ Soy China anomaly anomaly anomaly India anomaly Non Cropland Not shown anomaly Crop NDVI Anomaly NDVI -0.4 0 0.4 normal Worse than normal Better than normal Current season crop development (2012) Crop NDVI Anomaly, August 13th, 2012 Average season development (2000-2011)
Component 1 - Phase 1 : N. Hemisphere Crop Outlook for AMIS 2012 Crop Condition July 17, 2012 Russia Production 38MT= 32% Ukraine Production 15.5 MT = 30% Kazakhstan Production 10.5 MT = 53% 2012 drought affecting crop production in Russia, Ukraine, Kazakhstan Comparing the 2012 Black Sea Region Drought to the 2010 Drought Crop Condition During the 2010 Russian Drought: (July 17 2010) Vegetation Anomaly during the 2010 Russian drought, when grain production decreased by 30% and wheat prices rose over 80% in 6 months
Aggregation of Wheat Production Forecasts from Main Wheat Export Countries vs. International Market Price2010-2012 Price ($/Ton), Production Forecasts 1,000 MT Final Estimate 2012 2010 2011 Becker-Reshef et al.
GEOGLAM Goal of Timely Information on Crop Production using repeatable scientific methods to augment current operational procedures Critical Period for EO Harvest Final Estimate Points to the current advances in near real time EO data
Component 1 - Baseline Data Sets Current Cropland Distribution: best available from existing satellite-derived sources Source: IIASA, Fritz et al. Beta Version 1
Component 1 Transferring JRC MARS Monitoring Capabilities to FAO GIEWS
Component 2: National Capacity Building Argentina and Mexico Examples: Developing National EO Crop Condition Monitoring Systems
Component 5 Method Inter-comparisons • JECAM activities are being undertaken at a series of study sites which represent many of the world’s main cropping systems • 15 sites currently exist, at least 5 new in development, 3 dormant Sites in development
Component 4 - Defining Observation Requirements Information Products Identifying Information and Product Types EO Data Products • Crop outlook/ Early warning • Area estimate • Yield forecast • Production estimate • Food Sec/vulnerability report • Statistics reports • Cropland mask /Pasturelands • Ag practices • Crop condition indicators • Crop type • Biophysical variables • Environmental variables (soil moisture) • In-situ Weather
Recognition that cropping systems are inherently diverse which dictates the monitoring observations and methods
Component 4 -Defining Observation Requirements GEOGLAM CEOS: EO Data Requirements Table • developed taking into consideration the observation needs, the derived products they will • serve, and regional specificities; CEOS-GEOGLAM July 2012 Montreal) Component 4 Phase 1: Defining Observation Requirements Where? How often ? For What? When? spatial & spectral
Phased Implementation of EO Component 4 • Phase 0: Foundation Activities (2011-2013 ) Completed • Developing requirements approach & strategy • Development of baseline datasets • Phase 1: Demonstration & Early Feasibility Phase (2013 - 2015 ) • Focused on 5 countries 1 Region (4 large producer, 2 ‘at risk’) • Initial volumetric assessments • Focus on available Optical and SWIR Regional SAR (Asia Rice) • Phase 2: Assessment & Expansion (2014 –2016) • Pilot global sampling strategy for the main producers • New countries (~ 5) • New missions (Global SAR & sentinels) • Sampling strategy for at risk region- initiated • Phase 3: Pre-Operational (2015-2017) • Expand to all large producer countries (global producer sampling) • 3-5 At risk countries TBD • New missions acquired and new products • Validation/evaluation
Developing Inter-operable Sentinel-LDCM Datasets for Agriculture Monitoring Longitude: 1.4 34.6 Latitude: 44.4 51.6 NASA, CESBIO, ESA The large number of blue colored bands (>41 accesses) indicate that the revisit interval over the majority of the region is on the order of 2 days. • The picture shows the number of times LDCM and the Sentinel 2 satellites accessed areas on the ground over an 80 day period of time. • 21 accesses indicates a maximum revisit interval of ~3 days 19 hours • 46 accesses indicates a minimum revisit interval of ~1 day 18 hours
JPSS VIIRS / MODIS interoperabilty • for agricultural monitoring Vermote et al.
Sampling Strategy Preference is for wall to wall coverage BUT - recognizing this is not feasible for all GEOGLAM regions with high acquisition frequency, especially given cloud cover during growing season. • A nested stratified, multi-resolution sampling approach is being developed as an alternative • allows for more frequent acquisitions over selected sites that are statistically representative of entire area • NASA indicated intent to fund initial design of sampling approach
Multistage Samplinghigh, medium and low soybean strata using MODIS 250m Red=high (>19.8%), orange=medium (7.2-19.8%), yellow=low (0.5-7.2%)
Landsat (30m) sample blocks (S1)3-4 acquisitions during growing season Red=high (>19.8%), orange=medium (7.2-19.8%), yellow=low (0.5-7.2%)
RapidEye (5m) sample blocks- S2 Red=high (>19.8%), orange=medium (7.2-19.8%), yellow=low (0.5-7.2%)
EU FP 7 • 9 Million Euro Call in Process • France • GEOGLAM operations- secondment of project coordinator • Gates Foundation • Indicated interest in supporting Africa capacity building activities • Germany • Indicated interest to support GEOGLAM • Argentina (Ministry of Ag) • National capacity building initiative • Mexico (SIAP) • National capacity building initiative • World Bank