Download
1 / 51
510 likes | 683 Views
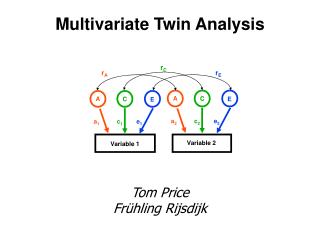
Univariate Twin Analysis. OpenMx Tc26 2012 Hermine Maes, Elizabeth Prom-Wormley, Nick Martin. Overall Questions to be Answered. Does a trait of interest cluster among related individuals? Can clustering be explained by genetic or environmental effects?

E N D
Univariate Twin Analysis • OpenMx Tc26 2012 • Hermine Maes, Elizabeth Prom-Wormley, Nick Martin
Overall Questions to be Answered • Does a trait of interest cluster among related individuals? • Can clustering be explained by genetic or environmental effects? • What is the best way to explain the degree to which genetic and environmental effects affect a trait?
Family & Twin Study Designs • Family Studies • Classical Twin Studies • Adoption Studies • Extended Twin Studies
569 total MZ pairs 351 total DZ pairs The Data • Australian Twin Register • 18-30 years old, males and females • Work from this session will focus on Body Mass Index (weight/height2) in females only • Sample size • MZF = 534 complete pairs (zyg = 1) • DZF = 328 complete pairs (zyg = 3)
Classical Twin Studies Basic Background • The Classical Twin Study (CTS) uses MZ and DZ twins reared together • MZ twins share 100% of their genes • DZ twins share on average 50% of their genes • Expectation- Genetic factors are assumed to contribute to a phenotype when MZ twins are more similar than DZ twins
Classical Twin StudyAssumptions • MZ twins are genetically identical • Equal Environments of MZ and DZ pairs
Basic Data Assumptions • MZ and DZ twins are sampled from the same population, therefore we expect :- • Equal means/variances in Twin 1 and Twin 2 • Equal means/variances in MZ and DZ twins • Further assumptions would need to be tested if we introduce male twins and opposite sex twin pairs
“Old Fashioned” Data Checking Nice, but how can we actually be sure that these means and variances are truly the same?
Univariate AnalysisA Roadmap • 1- Use the data to test basic assumptions (equal means & variances for twin 1/twin 2 and MZ/DZ pairs) • Saturated Model • 2- Estimate contributions of genetic and environmental effects on the total variance of a phenotype • ACE or ADE Models • 3- Test ACE (ADE) submodels to identify and report significant genetic and environmental contributions • AE or CE or E Only Models 10
mMZ1 mDZ1 mMZ2 mDZ2 Saturated Code Deconstructed mean MZ = 1 x 2 matrix mean DZ = 1 x 2 matrix
T1 T1 T2 T2 T1 T1 T2 T2 Saturated Code Deconstructed covMZ = 2 x 2 matrix covDZ = 2 x 2 matrix
Estimated Values • 10 Total Parameters Estimated mMZ1, mMZ2, vMZ1,vMZ2,cMZ21 mDZ1, mDZ2, vDZ1,vDZ2,cDZ21 • Standardize covariance matrices for twin pair correlations (covMZ & covDZ)
Estimated Values • 10 Total Parameters Estimated mMZ1, mMZ2, vMZ1,vMZ2,cMZ21 mDZ1, mDZ2, vDZ1,vDZ2,cDZ21 • Standardize covariance matrices for twin pair correlations (covMZ & covDZ)
Fitting Nested Models • Saturated Model • likelihood of data without any constraints • fitting as many means and (co)variances as possible • Equality of means & variances by twin order • test if mean of twin 1 = mean of twin 2 • test if variance of twin 1 = variance of twin 2 • Equality of means & variances by zygosity • test if mean of MZ = mean of DZ • test if variance of MZ = variance of DZ
Stats No significant differences between saturated model and models where means/variances/covariances are equal by zygosity and between twins
Questions? This is all great, but we still don’t understand the genetic and environmental contributions to BMI
Patterns of Twin Correlation ??? rMZ > 2rDZ Additive & Dominance DZ twins on average share 25% of dominance effects rMZ = 2rDZ Additive DZ twins on average share 50% of additive effects rMZ = rDZ Shared Environment Additive & “Shared Environment” A = 2(rMZ-rDZ) C = 2rDZ - rMZ E = 1- rMZ
A = 0.96 C = -0.20 E = 0.22 0.78 0.30 BMI Twin Correlations A = 2(rMZ-rDZ) C = 2rDZ - rMZ E = 1- rMZ ADE or ACE?
Univariate AnalysisA Roadmap • 1- Use the data to test basic assumptions inherent to standard ACE (ADE) models • Saturated Model • 2- Estimate contributions of genetic and environmental effects on the total variance of a phenotype • ADE or ACE Models • 3- Test ADE (ACE) submodels to identify and report significant genetic and environmental contributions • AE or E Only Models
ADE ModelA Few Considerations • Dominance refers to non-additive genetic effects resulting from interactions between alleles at the same locus • ADE models also include effects of interactions between different loci (epistasis) • In addition to sharing on average 50% of their DNA, DZ twins also share about 25% of effects due to dominance
ADE Model Deconstructed Path Coefficients covA <- mxAlgebra( expression=a %*% t(a), name="A" ) covD <- mxAlgebra( expression=d %*% t(d), name=“D" ) covE <- mxAlgebra( expression=e %*% t(e), name="E" ) 1 x 1 matrix 1 x 1 matrix 1 x 1 matrix
ADE Model DeconstructedVariance Components * 1 x 1 matrix * 1 x 1 matrix * 1 x 1 matrix
expMean expMean ADE Model DeconstructedMeans & Covariances expMean= 1 x 2 matrix T1 T2 T1 T2 covMZ & covDZ= 2 x 2 matrix
ADE Model DeconstructedMeans & Covariances T1 T2 T1 T2 T1 T2 T1 T2
ADE Model DeconstructedMeans & Covariances T1 T2 T1 T2 T1 T2 T1 T2
ADE Model Deconstructed 4 Parameters Estimated ExpMean Variance due to A Variance due to D Variance due to E
Univariate AnalysisA Roadmap • 1- Use the data to test basic assumptions inherent to standard ACE (ADE) models • Saturated Model • 2- Estimate contributions of genetic and environmental effects on the total variance of a phenotype • ADE or ACE Models • 3- Test ADE (ACE) submodels to identify and report significant genetic and environmental contributions • AE or E Only Models
Testing Specific Questions Please Open twinADEcon.R • ‘Full’ ADE Model • Comparison against Saturated • Nested Models • AE Model • test significance of D • E Model vs AE Model • test significance of A • E Model vs ADE Model • test combined significance of A & D
New Object Containing AE Model Object containing Full Model The d path will not be estimated Fixing the value of the c path to zero AE Model Deconstructed AeModel <- mxModel( AdeFit, name="AE" ) AeModel <- omxSetParameters( AeModel, labels=“d11", free=FALSE, values=0) AeFit <- mxRun(AeModel)
What about the magnitudes of genetic and environmental contributions to BMI?
Univariate AnalysisA Roadmap • 1- Use the data to test basic assumptions inherent to standard ACE (ADE) models • Saturated Model • 2- Estimate contributions of genetic and environmental effects on the total variance of a phenotype • ADE or ACE Models • 3- Test ADE (ACE) submodels to identify and report significant genetic and environmental contributions • AE or E Only Models
Okay, so we have a sense of which model best explains the data...or do we?
0.78 0.30 BMI Twin Correlations A = 2(rMZ-rDZ) C = 2rDZ - rMZ E = 1- rMZ ADE or ACE?
Giving the ACE Model a Try(if there is time) I think I would like to have the class “help” me put the ADE model together and run. However, I do have code ready for them to work on.
Conclusions • BMI in young OZ females (age 18-30) • additive genetic factors: highly significant • dominance: borderline significant • specific environmental factors: significant • shared environmental factors: not
Potential Complications • Assortative Mating • Gene-Environment Correlation • Gene-Environment Interaction • Sex Limitation • Gene-Age Interaction
For Your Reference: An Overall Map of the How Open Mx Processes Built the ADE Model as Coded in twinADEcon.R Make matrices pathA, pathD, pathE Do Matrix Algebra w Matrices covA, covD, covE, covMZ,covDZ Call Data for Use in the ModeldataMZ, dataDZ Call Data for Use in the ModeldataMZ, dataDZ Build Model from Matrices/Algebras modelMZ, modelDZ Build/Complie Overall Model from Matrices/Algebras AdeModel Run Overall Model AdeModel Get Summary Information from Overall Model AdeSumm Generate Parameter Estimates from Overall Model estMean, estCovMa, estCovDZ