Download
1 / 21
220 likes | 463 Views
Measuring Student Growth. An introduction to Value-Added. How do we measure student performance?. What do we want to do? Evaluate based on student testing performance Student outcomes determine whether the school is performing well Evaluate schools for meeting the needs of all students

E N D
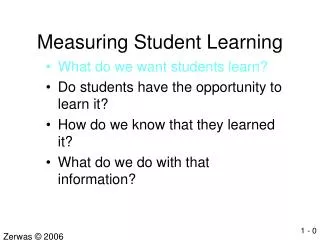
Measuring Student Growth An introduction to Value-Added
How do we measure student performance? • What do we want to do? • Evaluate based on student testing performance • Student outcomes determine whether the school is performing well • Evaluate schools for meeting the needs of all students • Accept students wherever they start and help students learn as much as possible from that starting point • Hold schools accountable for what they can control • Do not reward or penalize schools based on aspects of student performance they do not control • Measure should be valid regardless of differences in student population
How do we measure student performance? • How do we do this? • Attainment(example: the current NCLB method… percent proficient) • Gain / Growth (example: Florida’s FCAT Learning Gains) • Value-Added(example: Florida’s Value-Added Model) • The following non-education example tries to illustrate the difference between these measures.
Explaining the concept of Value-Added by evaluating the performance of two gardeners • For the past year, these gardeners have been tending to their oak trees trying to maximize the height of the trees. • Each gardener used a variety of strategies to help their own tree grow… which of these two gardeners was more successful with their strategies?
To measure the performance of the gardeners, we will measure the height of the trees today (1 year after they began tending to the trees). • Using this method, Gardener B is the superior gardener. This method is analogous to using an Attainment Model.
… but this attainment result does not tell the whole story. • These trees are 4 years old. • We need to find the starting height for each tree in order to more fairly evaluate each gardener’s performance during the past year. • The trees were much shorter last year. Oak A Age 3 (1 year ago) Oak A Age 4 (Today) Oak B Age 3 (1 year ago) Oak B Age 4 (Today)
We can compare the height of the trees one year ago to the height today. • By finding the difference between these heights, we can determine how many inches the trees grew during the year of gardener’s care. • Oak B had more growth this year, so Gardener B is the superior gardener. This is analogous to a Simple Growth Model, also called Gain.
… but this simple growth result does not tell the whole story either. • We do not yet know how much of this growth was due to the strategies used by the gardeners themselves. • This is an “apples to oranges” comparison. • For our oak tree example, three environmental factors we will examine are: • Rainfall, Soil Richness, and Temperature.
High Low Low High High Low
How much the gardeners’ own strategies contributed to the growth of the trees… • We can take out each environmental factor’s contribution to growth. • After these external factors are accounted for, we will be left with the effect of just the gardeners. • To find the correct adjustments, we will analyze data from all oaks in the region.
In order to find the impact of rainfall, soil richness, and temperature, we will plot the growth of each individual oak in the region compared to its environmental conditions.
Now that we have identified growth trends for each of these environmental factors, we need to convert them into a form usable for our calculations. Now we can go back to Oak A and Oak B to adjust for their growing conditions.
To calculate our new adjusted growth, we start with simple growth. • Next, we will use our numerical adjustments to account for the effect of each tree’s environmental conditions. • When we are done, we will have an “apples to apples” comparison of the gardeners’ influence on growth. +20 Simple Growth +14 Simple Growth
Based on data for all oak trees in the region, we found that high rainfall resulted in 3 inches of extra growth on average. For having high rainfall, Oak A’s growth is adjusted by -3 to compensate. Similarly, for having low rainfall, Oak B’s growth is adjusted by +5 to compensate. +20 Simple +14 Simple + 5 for Rainfall - 3 for Rainfall
For having poor soil, Oak A’s growth is adjusted by +3 to compensate. For having rich soil, Oak B’s growth is adjusted by -2 to compensate. +20 Simple +14 Simple + 5 for Rainfall - 3 for Rainfall - 2 for Soil + 3 for Soil
For having high temperature, Oak A’s growth is adjusted by +8 to compensate. For having low temperature, Oak B’s growth is adjusted by -5 to compensate. +20 Simple +14 Simple + 5 for Rainfall - 3 for Rainfall - 2 for Soil + 3 for Soil - 5 for Temp + 8 for Temp
Now that we have removed the effect of environmental conditions, our adjusted growth result puts the gardeners on a level playing field. We calculate that Gardener A’s effect on Oak A is +22 inches We calculate that Gardener B’s effect on Oak B is +18 inches +20 Simple +14 Simple + 5 for Rainfall - 3 for Rainfall - 2 for Soil + 3 for Soil - 5 for Temp + 8 for Temp _________ +18 inches Adjusted Growth _________ +22 inches Adjusted Growth
Using this method, Gardener A is the superior gardener. By accounting for last year’s height and environmental conditions of the trees during this year, we found the “value” each gardener “added” to the growth of the tree. This is analogous to a Value-Added Model. +20 Simple +14 Simple + 5 for Rainfall - 3 for Rainfall - 2 for Soil + 3 for Soil - 5 for Temp + 8 for Temp _________ +18 inches Adjusted Growth _________ +22 inches Adjusted Growth
How does this analogy relate to Value-Added calculations in the education context?
To summarize - what is the difference between these measures? • All are based on student test data, but the results are analyzed in different ways.