Download
1 / 53
530 likes | 643 Views
2013 Accountability Overview. Linda Jolly Region 18 ESC. Accountability System Differences. 2011 and before. 2013 and ??. Point based 4 Index Targets Miss 1 Target All students count Integrated with federal. % meeting standard 25 indicators Missed 1 = Unacceptable

E N D
2013 Accountability Overview Linda Jolly Region 18 ESC
Accountability System Differences 2011 and before 2013 and ?? Point based 4 Index Targets Miss 1 Target All students count Integrated with federal • % meeting standard • 25 indicators • Missed 1 = Unacceptable • Not all students counted • Separate from federal
Differences • Emphasis now on: • Individual student progress • Closing the gaps • Post-secondary readiness
Rating Labels • Met Standard • Met Alternative Standard (for AEA) • Improvement Required • Not Rated (for DAEP, JJAEP,…)
STAAR Level II passing standards will be phased-in • Phase 1 2012 and 2013 • Phase 2 2014 and 2015 • Final 2016 and beyond (final panel-recommended standards STAAR/EOC Phase-in of Standards
Performance Index Criteria2013 Rating Labels 2013 Rating Labels: • Met Standard – met performance index targets on all indexes for which they have performance data in 2013. • High Schools – All 4 index targets • Elementary and Middle Schools – All 3 index targets where they have data. • Improvement Required: Did not meet one or more performance index targets.
2013 Performance Index Targets To receive a Met Standard Rating all non-AEA campuses and districts must meet the following accountability targets on all indexes for which they have performance data in 2013
2013 Accountability Snapshot The following snapshot table applies to Index 1, 2, and 3:
STAAR Phase-in Final and Recommended Level II and Level III Standards TEA proposal change is to maintain Phase 1 for the 2013-2014 school year for all assessments
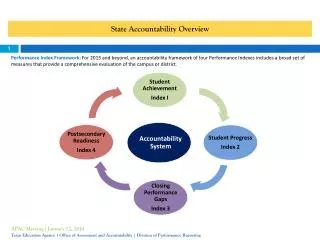
Index 1: Student Achievement Index 1: The purpose of this index is to provide a snapshot of performance across all subjectsat the satisfactory performance standard (Phase-in I Level II). • Subjects: Combined over Reading, Mathematics, Writing, Science and Social Studies. • Student Groups: All Students only
Index 1: Student Achievement • Performance Standards: Phase-in I Level II Standard (Satisfactory) on the following assessments: • STAAR Grades 3-8 English and Spanish (3-5) Spring 2013 • EOC Assessments (best results: highest score) Spring 2013, Fall 2012, and Summer July 2012 • STAAR Grades 3-8 and EOC Modified for Spring 2013 • 2013 only: TAKS, TAKS Accommodated and TAKS-Modified • Grade 11 Results at Met Standard Performance • Primary Administration only • 2014 and beyond will not include TAKS
Index 1: Region 18 TARGET = 50 Level I – Not Met Standard/Unsatisfactory Academic Performance Level II - Met Standard /Satisfactory Performance Level III – Advanced Academic Performance/
Index 2: Student Progress Index 2: Student Progress focuses on actual student growth independent of overall student achievement levels. • Subjects: Reading, Mathematics, and Writing in available grades • Ten Student Groups Evaluated: • All Students • Students served by Special Education • English Language Learners (ELL) • Seven Racial/Ethnic Groups: African American, American Indian, Asian, Hispanic, Pacific Islander, White, and Two or More Races
Index 2: Student Progress Targets High Schools = 17 Middle Schools = 29 Elementary = 30 AEA = 9 • Three Growth Indicators: • Did Not Meet Growth Expectation = 0 • Met Growth Expectation = 1 • Exceeded Growth Expectation = 2 • Credit based on weighted performance: • One point credit given for each percentage of tests at Met Growth expectations level. • Two points credit given for each percentage of tests at the Exceeded growth expectations level. # of points = Points earned # of tests
Index 3: Closing Performance Gaps Index 3: Closing Performance Gaps emphasizes advanced academic achievement of economically disadvantaged students and the two lowest performing race/ethnicity students groups. • Subject Area: Reading, Mathematics, Writing, Science and Social Studies • Student Groups: • Economically Disadvantaged • Lowest Performing Race/Ethnicity: Two lowest performing race/ethnicity student groups on the campus or district (based on prior-year assessment results) Sub Pop 1 and 2 are determined as the lowest performing from 2012 results. ELLS are excluded
Index 3: Closing Performance Gaps Credit based on weighted performance: • Phase-in Level II satisfactory performance -2013 and beyond • One Point for each percent of students at the Phase-in Level II satisfactory performance standard. • Level III Advanced performance – 2014 and beyond • Two points for each percent of students at the Level III advanced performance standard.
Index 3: Closing Performance Gaps Calculation Report Region 18
Index 3: Closing Performance Gaps Calculation Report Region 18
Index 3: Closing Performance Gaps Data TableRegion 18 Here is your 2012 STAAR results that determines your 2 sub pops
Index 4: Postsecondary Readiness Index 4: Postsecondary Readiness emphasizes the importance for students to receive a high school diploma that provides them with the foundation necessary for success in college, the workforce, job training programs, or the military; and the role of elementary and middle schools in preparing students for high school.
Index 4: Postsecondary Readiness Graduation Score: Combined performance across the graduation rates from either the 4 year or 5 year graduation rates and the Diploma Indicator: • Grades 9-12 Four-Year Graduation Rate for All Students and all student groups orGrades 9-12 Five-Year Graduation Rate for All Students and all student groups, whichever contributes the higher number of points to the index • RHSP/DAP Graduates for All Students, ELL, Special Ed, and 7 race/ethnicity student groups (Diploma Plan Indicator)
Index 4: Postsecondary Readiness STAAR Score: • STAAR Percent Met Final Level II on One or More Tests for All Students and race/ethnicity student groups (2014 and beyond) • Subjects: Reading, Writing, Math, Science and Social Studies • Student groups: All students and 7 race/ethnicity student groups: African. Am., Am. Indian, Asian, Hispanic, Pacific Islander, White, Two or more races. • Minimum size criteria: All students – none, small analysis if fewer than 10. Student groups >=25
Index 4: Post Secondary Readiness Calculation ReportRegion 18 Score 4yr Grads (2012) 5yr Grads (2011) OR # of RHSP/DAP (2012) # of Grads (2012) Score OR
Index 4: Postsecondary Readiness Data Table Region 18 Emphasis on this index is the importance of students to receive a hs diploma that provides them with the foundation for success in college, workforce, job training, or military.
System Safeguards • With the PI (Performance Index) framework, poor performance in one subject or one student group does not result in an Improvement Required Rating. • However, districts and campuses are responsible for addressing performance for each subject and each student group. • System safeguards are added to ensure that poor performance in one area or one student group is not masked in the performance index. • Participation rates, graduation rates, and limits on use of STAAR Alternate and STAAR Modified are calculated to meet federal requirements. • Texas Accountability Intervention System (TAIS)
System Safeguards Region 18 Failure to meet the safeguard target for any reported cell must be addressed in the CIP/DIP.
Distinction Designations • Campuses that receive an accountability rating of Met Standard are eligible for Distinction Designation Campus Designations awarded: • Top 25% Student Progress – based on performance on Index 2: Student Progress. Campuses that are in the top quartile of their campus comparison group (40 campuses) • Academic Achievement in Reading/ELA – outstanding academic achievement in Reading/ELA on a variety of indicators • Academic Achievement in Mathematics – outstanding academic performance in Math on a variety of indicators.
Top 25% Student Progress Distinction • Campuses in the top 25% (top 10 in group) of their campus comparison group (40 campuses) on Index 2: Student Progress score are eligible for a distinction designation for student progress. • Campuses only • Eligibility criteria – Met Standard rating • Campuses in the top 25% in student progress • Campus comparison groups set by TEA based on campus similarities
Academic Achievement Distinction Designations • Distinction Designation Indicators • Twenty-two indicators will be used to determine outstanding academic achievement and will vary by type of campus and by subject. • Indicators evaluated include performance at the STAAR Level III (Advanced) standard for selecting grades and subject areas in elementary and middle schools, and indicators including SAT/ACT and AP/IB participation and performance for high schools.
2013 Academic Achievement Distinction Designations (AADD) Indicators
2014 Accountability Looking at what is ahead…
STAAR Assessments for 2014 HB 5 • STAAR Continues to test for Grades 3-8 • Mathematics at grades 3-8 • Reading at grades 3-8 • Writing at grades 4 and 7 • Science at grades 5 and 8 • Social Studies at grade 8
STAAR Assessments for 2014 HB 5 • STAAR EOC Assessments required to pass for high school graduation: • English I (reading and writing combined) • English II (reading and writing combined ) • Algebra I • Biology • U.S. History (Cohort 2011/2012 and Thereafter)
STAAR Assessments for 2014 HB 5 • EOC Assessments no longer required or available: • Geometry • Algebra II • Chemistry • Physics • World Geography • World History • English III
STAAR Assessments for 2014 HB 5 • STAAR EOC Assessments no longer include: • A cumulative score requirement for graduation. • A minimum score to count towards the cumulative score. • The requirement that the score count as 15% of the final course grade.
STAAR Assessments for 2014 HB 5 • STAAR EOC Assessments Requirements: • The commissioner is required to provide a scale score to 100-point score conversion table. • Districts are required to provide accelerated instruction to students EACH time a student fails any of the five STAAR EOC assessments in the applicable subject area prior to the next administration of the test. • District shall use funds appropriated for AI (accelerated instruction), and must provide the AI at no cost to student. • District must evaluate the effectiveness of all AI programs for EOCs and annually hold a public meeting to consider the results.
STAAR Assessments for 2014 HB 5 • STAAR English I and II: • Instead of having separate reading and writing assessments, these tests will be combined into one assessment per course with one score. • The combined assessments will be available beginning in spring 2014.
Release of STAAR Assessments HB 5 • Requires the agency to release the general STAAR assessments for grades 3-8 and EOC (first spring form only) and STAAR Spanish assessments for grades 3-5 (first spring form only) in: • 2012-2013, 2013-2014, 2014-2015, 2015-2016 • Requires the agency to release STAAR Modified for grades 3-8 and EOC (first spring form only) in: • 2013-2014, 2014-2015, 2015-2016 • Requires the agency to release the general STAAR, STAAR Spanish, and STAAR Modified every third year thereafter.
Other Assessment Changes HB 5 • Requires the commissioner to establish assessment administration procedures that minimize disruptions to school operations and classroom environments. • Prohibits districts from removing students from class for remedial tutoring or test preparation for more than 10% of the school year (parent permission exception). • Limits the number of benchmark assessments to two per state assessment (does not apply to college preparation assessments such as AP, IB, SAT, ACT). Parents of students with special needs may request additional assessments. • A student is not considered to be enrolled in a U.S. school for a school year unless he/she is enrolled for a period of at least 60 consecutive days.
Accountability Changes for 2014 • Each district must annually evaluate district and campus performance in community and student engagement and assign a performance rating of Exemplary, Recognized, Acceptable or Unacceptable. Required measures to be evaluated: • Fine Arts • Wellness & PE • Community and parental involvement • 21st Century Workforce Development • Second Language Acquisition • Digital Learning • Dropout Prevention Strategies • Educational programs for G/T students • Record of the district and campus in complying with statutory reporting and policy requirements Each district will use criteria developed by a local committee and will report ratings to TEA and make ratings publicly available by August 8th of each year.
Accountability Changes for 2014HB5 Distinction Designation TEA shall issue district and campus distinction designations with district/campus ratings by August 8th each year (in connection with performance ratings). District and campus distinction designations shall be awarded for outstanding performance in attainment of postsecondary readiness and MUST include, as newly added factors, the % of students who: • Earned a nationally or internationally recognized business or industry certification or license • Completed a coherent scope and sequence of CTE courses • Completed a dual credit course or an articulated postsecondary course • Achieved applicable college readiness benchmarks or the equivalent on PSAT, SAT, ACT, or ACT Plan • Received a score on AP or IB assessments sufficient to be awarded college credit. • Campus-only distinction designations remain largely unchanged(top 25% for annual improvement in student progress, top 25% in closing student achievement differentials, outstanding performance in ELA, Math, Science or Social Studies, outstanding performance in advanced middle or junior high school achievement) BUT distinctions on fine arts, PE, 21st Century Workforce, and second language acquisition have been removed from TEA’s domain and moved to the district level.