Download
1 / 21
210 likes | 328 Views
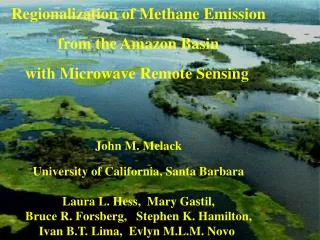
Regionalization of Methane Emission from the Amazon Basin with Microwave Remote Sensing John M. Melack University of California, Santa Barbara Laura L. Hess, Mary Gastil, Bruce R. Forsberg, Stephen K. Hamilton, Ivan B.T. Lima, Evlyn M.L.M. Novo.

E N D
Regionalization of Methane Emission from the Amazon Basin with Microwave Remote Sensing John M. Melack University of California, Santa Barbara Laura L. Hess, Mary Gastil, Bruce R. Forsberg, Stephen K. Hamilton, Ivan B.T. Lima, Evlyn M.L.M. Novo
Evaluate emission of methane from Amazon wetlands Remotely-sensed estimates of seasonally of inundation and wetland vegetation Measurements of methane emission from wetland habitats (open water, flooded forests and floating macrophytes)
Remote sensing of temporal variation in extent of inundation and aquatic vegetation Monthly inundated areas – Mixture model of 37 GHz polarization difference observed by Scanning Multichannel Microwave Radiometer (1979-1987) Inundation and aquatic vegetation at high (1996) and low (1995) river levels – Segmentation and classification of L-band synthetic aperture radar data obtained by Japanese Earth Resources Satellite Validation of inundation and aquatic vegetation – Examination of airborne digital videography
R N A B
SMMR-based inundation area: 7-year time series for central Amazon study reach
Classified JERS-1 Mosaics: Low and High Water Low Water High Water Non-wetland mask Flooded grass, shrub, treetop Open water Forest Soil, grass, low shrub Flooded forest
Cabaliana Floodplain High Water Low Water Water Bare or herbaceous, non-flooded Herbaceous, flooded Shrub, non-flooded Shrub, flooded Woodland, flooded Forest, non-flooded Forest, flooded
x Digital videography for validation Hess et al. 2002. Int. J. Remote Sens. 23: 1527-1556
Areal extent of aquatic habitats on Solimoes-Amazon floodplain
Methane emission measurements Selected habitat-specific measurements (aquatic macrophytes, flooded forest and open water) from Devol et al. (1990, JGR 95: 16417-16426) composited from 8 lake seasonal survey and regional sampling using different emission rates from aquatic macrophytes for high and low water levels. River channel emission from Richey et al. (1988, L&O 33: 551-561)
Uncertainty Analysis Uncertainties in the regional emission rates were determined by Monte Carlo error analyses that combined error estimates for the measurements of emission and for calculations of inundation and habitat areas.
Solimoes – Amazon River Floodplain Methane Emission, Tg C y-1 Aquatic macrophytes 0.63+ 0.1 Flooded forest 0.61 + 0.2 Open water 0.087 + 0.02 River channel 0.008 + 0.001 Total 1.3 + 0.3
Methane emission from Solimoes-Amazon floodplain Mean Area uncertainty min mean max Minimum, mean and maximum inundation (Sippel et al. 1998) with uncertainty derived from monte carlo error analysis. Methane emission from Devol et al. (1990)
Central Amazon Basin (1.77 million km2) Methane Emission CO2 Evasion Tg C y-1 Tg C y-1 6.8 + 1.3 210 + 60
Lowland Amazon Basin (<500 m asl) (5.19 million km2) Methane Emission 22 Tg C y-1 Greenhouse gas potential ~ 0.5 Pg C y-1 as CO2
Tropical South American Savannas Mean Flooded Methane Emission Area, km2 Tg C y-1 Mojos 29,500 2.1 Roraima 3,500 0.3 Bananal 13,100 0.9 Orinoco 34,700 2.5 Pantanal 34,900 2.5
Research Needs Process-based models Ecological studies and methane emission measurements Seasonally flooded savannas Floodplains in eastern Peru Interfluvial wetlands in upper Negro basin Freshwater wetlands in Amazon delta Riparian zones of streams
References: Melack et al. 2004. Regionalization of methane emission in the Amazon Basin with microwave remote sensing. Global Change Biology 10: in press Hess et al. 2003. Dual season mapping of wetland inundation and vegetation for the central Amazon basin Remote Sensing of Environment 87: 404-428 Hess et al. 2002. Geocoded digital videography for Validation of land cover mapping in the Amazon basin. Internat. J. Remote Sensing 23: 1527-1555 Sippel et al. 1998. Passive microwave observations of Inundation area and the area/stage relation in the Amazon River floodplain. Internat. J. Remote Sensing 19: 3055-3074