Download
1 / 28
280 likes | 402 Views
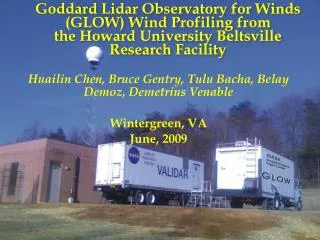
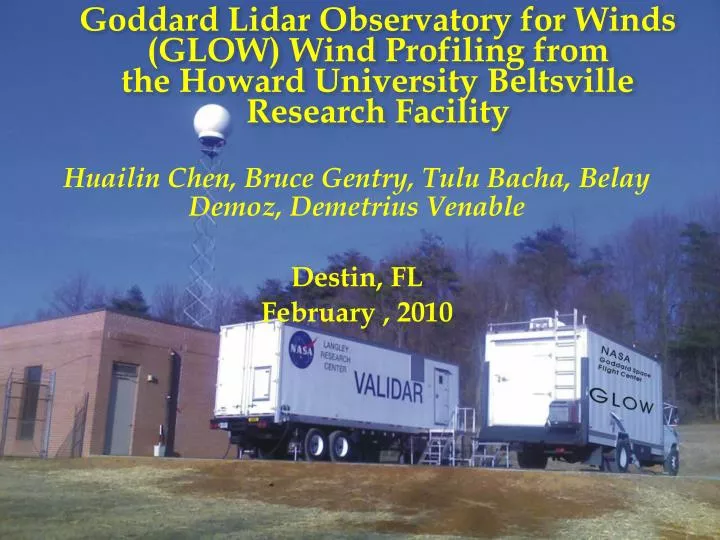
Goddard Lidar Observatory for Winds (GLOW) Wind Profiling from the Howard University Beltsville Research Facility. Huailin Chen, Bruce Gentry, Tulu Bacha, Belay Demoz, Demetrius Venable Destin, FL February , 2010.

E N D
Goddard Lidar Observatory for Winds (GLOW) Wind Profiling from the Howard University Beltsville Research Facility Huailin Chen, Bruce Gentry, Tulu Bacha, Belay Demoz, Demetrius Venable Destin, FL February , 2010
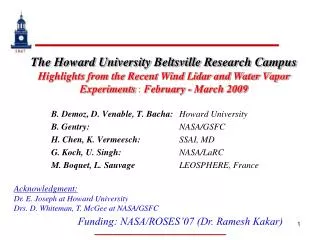
NASA Wind Lidar Science (WLS) Experiment at Howard Beltsville Research Facility GOALS • Develop understanding of direct detection (GLOW) wind speed and direction performance for various cloud and aerosol loading conditions (pollution, cirrus), using the 355nm backscatter ratios and water vapor data independently measured by the Raman lidar as well as synergistic measurements from the Beltsville instrument suite. • Develop a seasonal data base archive for wind measurements. • Intercomparison of coherent and direct detection Doppler lidars • Compare Doppler lidar wind data to other sensors (Profiler, Radiosonde, ACARS). Funded by NASA SED, ROSES07-WLS (Dr. Ramesh Kakar)
Overview for GLOW • Goddard Lidar Observatory for Winds (GLOW) mobile Doppler lidar • Direct detection Doppler Lidar system • Measures clear air wind profiles using molecular backscatter • Serves as testbed for air and space based lidar technologies • Multiple field campaigns since 2000 Line of sight wind profiles are sequentially measured at 4 azimuth angles (N,S,E,W)+vertical. The multiple direction LOS profiles are combined to produce vertical profiles of horizontal wind speed and direction (right) • Measurement summary • Vertical resolution=250 m • t=3 min • Altitude range= 2 to 15 km • Elevation angle= 45 deg • Scan pattern = 4 directions: (N,S,E,W)+vertical • Dwell per LOS = 30 sec
Upgrades for GLOW • Laser ( 50Hz, 25mJ/pulse, Diode pumped ) • Reference Signal Measurement • Electronics ( Preamps, discriminators, boxcar integrators) • Etalon Calibration
Laser • Diode Pumped, 50Hz, 20mJ/pulse • More Stable seed laser • Less energy consumption improves the temperature stability inside GLOW
Laser Reference Signal Sampling Optics M1 BS R=95%, T=5% Lidar Signal+ Reference Signal Fiber Collimator Fiber Collimator Reference Signal Fiber To Receiver IF Lidar Signal Fiber Fiber Collimator From Telescope Reference Measurement
Wind Measurements in 2009 • From Feb. 21 to Oct. 20, 50days, 310 hours • Variety weather conditions: different aerosol loadings, cirrus clouds at different altitude, front passage. • GLOW-Validar Intercomparison: Feb 21-Mar 10. GLOW/Validar/AT/ALVICE HURL/Sonde/915 MHz profiler • Mar. 2009 Campaign: Mar. 20-31 . GLOW/AT/ALVICE HURL/Sonde/915 MHz profiler • Regular GLOW/Sonde comparisons
Results from March 2009 Campaign March 22-23, 2009
Results from March 2009 Campaign March 30-31, 2009
Summary and Future Work • Wind measurement on regular basis • Sonde comparison validation • Continue wind data collection. • 2 to 3 days a week • Coordinate with NWAVES • Use the GLOW data in WRF model • Participate field campaigns
GLOW Lidar System Parameters Wavelength 354.7 nm Telescope/Scanner Area 0.116 m2 Laser Linewidth (FWHH) 80 MHz Laser Energy/Pulse 25 mJ @ 50pps Etalon FSR 12 GHz Etalon FWHH 1.7 GHz Edge Channel Separation 5.1 GHz Locking Channel Separation 1.7 GHz Interference filter BW (FWHH) 150 pm PMT Quantum Efficiency 22%
2 1 3 5 4 2 1 5 3 4 • Sampling strategy: • LOS scans at multiple azimuths • in repeating cycle (5-10 LOS /cycle) • Step stare scan pattern at fixed elevation angle (Typ. 45 deg) : 4 cardinal directions (N,S,E,W) + vertical • Signals are range gated in 30 m bins, • integrated and stored every 10 s. Three • dwells (30s total) per LOS. Total time to complete scan: ~3 min • Post processing: • data averaged in range (default 250 m) • data can be accumulated in time by LOS • (multiples of base 3 min) • corrections for atmos. T and P (RBS)
2 1 5 3 4
Combined Molecular Sensitivity vs. T and v T= 150K to 350K , v = 0 to 100 m/s