Download
1 / 55
550 likes | 676 Views
This presentation by Wayne Abba from Abba Consulting provides a comprehensive overview of Earned Value Management (EVM) and its critical role in program resource management. It covers essential data elements and graphics, detailing how to conduct Earned Value Analysis (EVA), assess funding status, and manage baselines. Attendees will learn about the relationships among EVM data elements and the importance of resource management, including labor, materials, and costs. The session explores practical scenarios, variance analysis, and the integration of cost-schedule data for effective program oversight.

E N D
Understanding Program Resource Management through Earned Value Analysis “Reading the Abba Charts” Wayne Abba PMI WDC Tool Time, July 18, 2006 Abba Consulting
Agenda • Earned Value Management and Resource Management • Essential Data Elements and Graphics • Earned Value Analysis • EVA Scenarios • EVA and Funding Status • Baseline Management • Summary
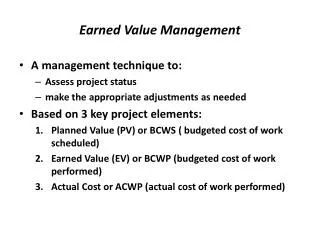
Resource Management • Earned Value Management = Resource Management • Resources are labor, material and other direct and indirect costs required to execute the program • FAA applies EVM at Program level to include prime and subcontractors, government FTEs, support contractors • Managed in dollars, hours, or any measurable unit • Cost and schedule data summarized directly from contracts and programs for management and reporting at all levels
Budgeted Cost for Work Scheduled Budgeted Cost for WorkPerformed Actual Cost of WorkPerformed - Approved baseline time-phased plan for resources to be consumed (e.g. 100 hours) - Work accomplished in terms of planned resources(e.g. 100 hours) - Actual cost of the resources consumed(e.g. 120 hours) - Reconcilable to accounting system EVM Terminology and Resource Management Assume basic understanding – Earned Value Management Concept and Terminology
Agenda • Earned Value Management and Resource Management • Essential Data Elements and Graphics • Earned Value Analysis • EVA Scenarios • EVA and Funding Status • Baseline Management • Summary
At Complete Variance Risk Schedule Slip J M J A A J EVM Trend Analysis: Cumulative Time Now Prog Budget Management Reserve ACWP (Actual Cost) Resources BCWS (Planned Value) Cost Variance 400 Schedule Variance BCWP (Earned Value) 300 200 100 Time ▲ M F Approx. Time Variance
Management Reserve EVM Trend Analysis:Cost/Schedule Variances ManagementReserveConsumption $ Favorable Schedule Variance at Completion 0 $ Unfavorable Cost Variance at Completion Time Schedule Slip Cost Variance --- Schedule Variance
Agenda • Earned Value Management and Resource Management • Essential Data Elements and Graphics • Earned Value Analysis • EVA Scenarios • EVA and Funding Status • Baseline Management • Summary
A-10 A-12 B-1 B-2 C-17 DDG-51 F-18 F-22 C-130H & J Chinook Apache Longbow Blackhawk Kiowa Seahawk Comanche T-45 T-46 CVN-68 SSN-21 SSN-688 SSN-774 T-AOE-6 LHD-1 Crusader M1 M2/M3 FVS MK-48 ADCAP MK-50 ALWT SSBN-726 CG-47 MH-53 V-22 Osprey P-3 Orion RCAS LIF Hawk DoD Experience • B-1 Engines • F-414-GE-400 Engines • Chem. Demilitirization • D-5 TRIDENT II • Javelin • Pershing II • FAMECE/UET • Satellites • AN/BSY-2 • THAAD • ABL • GBL • * Aggregate overrun 5.5% on 115 largest DoD contracts ($3.0B on $84.8B @ 60% complete), adjusted for over target baselines a/o 4/30/2000 * OUSD(AT&L)ARA/AM, 1/16/01
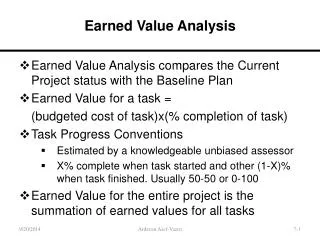
Earned Value Analysis • Earned Value Analysis = Understanding the relationships among the EVM data elements • EVM discipline provides confidence • Contractor and PM management systems are adequate • Data are summarized from the Control Account level, where technical/schedule/cost integration occurs • Use the data for management and oversight • Data quality becomes “self-policing” • Ask questions – be an informed, critical consumer
J Planned Resource Consumption Program Budget $M 40 Management Reserve 35 30 25 Resources BCWS (Planned Value) Time-Phased Plan for Consumption of Resources Typical “S” Curve 20 15 10 5 ▲ M J F M A J D A S O N Time
J M J A A J Integrated Baseline Review (IBR):Does Planned Resource ConsumptionMake Sense? Program Budget $ Resources Front Loaded Normal 400 End Loaded 300 200 100 Time M F
Program Budget Front Loaded $ Resources 400 300 J A A J M J 200 100 Time M F Baseline Extremes: Front-Loaded • Rapid start • Most resources to be consumed early in plan • Questions • What is basis for plan? • Are resources available? • Do IBR and review supporting documentation
Program Budget $ Resources 400 End Loaded 300 200 100 A J M J A J Time M F Baseline Extremes: End-Loaded • Slow start • Most resources to be consumed late in plan • Questions • What is basis for plan? • Is schedule realistic? • Do IBR and review supporting documentation
Normal Baselines • Normal “S” curve for planned value • Questions • Is scope fully and mutually understood (using WBS)? • Does the baseline capture all work? • Labor resources • Are in-house resources available and adequate? • Are contractor resources available and adequate? • Material resources • Are contracts awarded/planned? • Is the schedule logical and complete? • Risk management • Is Management Reserve adequate given expected risk?
Normal Baselines cont’d • Management System • Does management system meet ANSI EVMS guidelines? • Are managers trained? • Are EVM techniques objective? • Is “Level of Effort” scope properly categorized? • The Bottom Line • Does the program have an executable plan that integrates scope, planned cost and schedule resources and risk? • If “no,” go slow… better to do it right than to fail
Time - Based Planning Horizons Rolling Wave 2 Rolling Wave 3 Rolling Wave 1 ProgramBudget $ Resources Initial detail planning (6 Months) 400 300 • Future work in planning packages • Detail planning based on calendar • Arbitrary 200 100 Time S D M J D M J S
Event - Based Planning Horizons Critical Design Review Preliminary Design Review ProgramBudget $ Resources Initial detail planning • Future work in planning packages • Detail planning based on technical objectives • Facilitates event-based reporting incentives • Better integration of technical, schedule and cost performance and risk management 400 300 200 100 Time S D M J D M J S
Agenda • Earned Value Management and Resource Management • Essential Data Elements and Graphics • Earned Value Analysis • EVA Scenarios • EVA and Funding Status • Baseline Management • Summary
Earned Value Analysis Scenarios The Ideal Portfolio Management Early Warning Indicators Know How to Get Help
Schedule Slips • Problem indicators • Early, large and unfavorable schedule variance • Front-loaded baseline • Zero variance • “Too good to be true” • Slow resource consumption • “Can’t get there from here”
Unfavorable Schedule Performance Time Now Prog Budget BCWS (Planned Value) Schedule Slip $ Resources 400 Schedule Variance BCWP (Earned Value) 300 200 100 Time ▲ A M J J J F M A
Unfavorable Schedule Performance Time Now Schedule Variance at completionis zero bydefinition-even if programcompleteslate $ Favorable 0 $ Unfavorable Time Schedule Variance Schedule variance should supplement “real” schedule analysis
Cost Overruns • Problem indicators • Early, large, unfavorable schedule variance • Time is money • Unfavorable cost variance • Front-loaded baseline • Zero variance • “Too good to be true” • Excessive resource consumption • “Can’t get there from here”
At Complete Variance J M J A A J Unfavorable Cost Performance Time Now Prog Budget Management Reserve ACWP (Actual Cost) $ Resources BCWS (Planned Value) Cost Variance 400 BCWP (Earned Value) 300 200 100 Time ▲ M F
Management Reserve Unfavorable Cost Performance Time Now $ Favorable 0 $ Unfavorable Time Cost Variance ---
Management Reserve Evaluating Future Performance Time Now $ Favorable 0 PM Varianceat Completion $ Unfavorable Time Cost Variance --- • When/how will performance improve? • Review at appropriate time • Tie PM evaluation to predictability
Management Reserve Evaluating Future Performance Time Now $ Favorable 0 PM Varianceat Completion $ Unfavorable Time Cost Variance --- • When/how will performance improve? • Review at appropriate time • Tie PM evaluation to predictability
A-12 Contract – Front Loaded • Largeunfavorable variances • “Connect the dots” • Front-loaded Baseline • (or completion date is wrong) • No work planned ’93 – ’96?
A-12 Contract – Actual Cost vs. EAC • Contractor and PM EACs both imply no cost accrual for several years during key manufacturing/test phases • Realistic EAC “off the chart”
Excessive Optimism • Problem indicators • Future performance predicted to be significantly better than historical performance • Variance trend analysis • Cost Performance Index compared toTo Complete Performance Index (CPI vs TCPI) • Actual trend and implied future trend diverging • One of most powerful EVA techniques • Independent EV analysis balances PM bias
A-12 Contract – Optimistic EACs • Contractor estimates program will begin to underrun • PM estimates all problems will be resolved – and no new problems will occur • Realistic EAC variance “off the chart”
Super Hornet Cumulative Trends • Cost-type contract • Significant cost risk • No variances • Too good to be true? • No scope change • Effective planning • IPTs used EVM effectively • Excellent performance
Super Hornet Variance Trends • Substantial Management • Reserve
Average Future Performance must Equal TCPI To Achieve Indicated Efficiency in Estimateat Completion Given Performance to Date (cumulative CPI) Past vs. Future Efficiency: CPI vs. TCPI Time Now TCPI EAC Efficiency Index CPI Cum CPI Current >1.0 1.0 <1.0 Time
CPICUM TCPIEAC ( ) 1 x 100 No Confidence Questionable Percent Difference Cumulative Efficiency / Required Efficiency Acceptable Questionable No Confidence Contract:FAA XXX Contractor:Air Systems Inc.as of January 2006 Confidence in EstimateCan program complete at PM’s current estimate? Adapted from USAF
Zeroing in on the EAC Contract Budget: PM Estimate: Independent High: Independent Low: $20.8M $20.8M $23.3M $22.0M $19 $20 $21 $22 $23 Contract:FAA XXXContractor: FAA Contractoras of April 2006 Adapted from USAF
Agenda • Earned Value Management and Resource Management • Essential Data Elements and Graphics • Earned Value Analysis • EVA Scenarios • EVA and Funding Status • Baseline Management • Summary
D M J S S J EVA and Funding Status Time Now Prog Budget BCWS (Planned Value) Resources 400 ACWP (Actual Cost) Approved/Planned Funding 300 200 BCWP (Earned Value) 100 Time D M
Cost Variance --- Schedule Variance Management Reserve Profitability Analysis on Flexibly Priced Contracts Cost Variance levelsrelated to: Time Now $ Favorable Min/MaxFee 0 Cost Sharing $ Unfavorable Contractor Loss Time
Cost Variance --- Schedule Variance Management Reserve Profitability Analysis on Flexibly Priced Contracts Cost Variance levelsrelated to: Time Now $ Favorable Min/MaxFee 0 Cost Sharing $ Unfavorable Contractor Loss Time
Agenda • Earned Value Management and Resource Management • Essential Data Elements and Graphics • Earned Value Analysis • EVA Scenarios • EVA and Funding Status • Baseline Management • Summary
Baseline Discipline • Effective performance management requires disciplined baseline management • Initial baseline reflects go-ahead decision • Scope, schedule, resources, risk • Approve baseline changes to • Revise work scope (increase or decrease) • Restore meaningful performance management • Manage funding reductions (“salami slices” or prioritized cuts?) • Balance scope, schedule, cost, risk assumptions • Do not approve baseline changes to • “Get to Green” • Eliminate cost and schedule variances
J A J O O J Baseline Discipline Time Now Program Budget BCWS ACWP $ Resources • No Variances • Lack of definition and discipline • Baseline & schedule growth preclude measurement 400 300 BCWP 200 100 Time J A
Rebaselining • When the original baseline becomes unrealistic as a basis for management and measurement, it may be necessary to establish a new baseline • A question of degree – what is ‘unrealistic?’ • Challenge assumptions • Issues: • Visibility to original baseline • Reporting to stakeholders
M D J S Establishing a New Baseline Time Now Program Budget Management Reserve $ Resources ACWP • Baseline no longer meaningful to manage performance 400 BCWS 300 200 BCWP 100 Time ▲ D A
M J D J S S Establishing a New Baseline Time Now Revised Budget Program Budget Original Budget Management Reserve NewBaseline BCWS $ Resources ACWP 400 BCWS • “Single Point Adjustment” • Eliminates variances • Establishes new baseline including Reserve if needed 300 200 BCWP 100 RevisedSchedule ▲ D A
Cost Variance ------- Schedule Variance Management Reserve Establishing a New Baseline Time Now $ Favorable 0 $ Unfavorable Time
Cost Variance ------- Schedule Variance Management Reserve Establishing a New Baseline Time Now $ Favorable 0 • “Single Point Adjustment” • Eliminates variances • Establishes new baseline including MR if needed • History is lost • Temptation to “get to Green” $ Unfavorable Time
Cost Variance ------- Schedule Variance Management Reserve Establishing a New Baseline Time Now $ Favorable 0 $ Unfavorable Time