Download
1 / 18
180 likes | 306 Views
GTE Winter Outlook 2007 Brussels, January 8 th 2008 Paolo Mosa GTE Vice-President Chairman of the GTE Transparency WG. Table of contents. Background Updated results Additional findings. Background. GTE WO presented to GCG on 25 th October for the first time

E N D
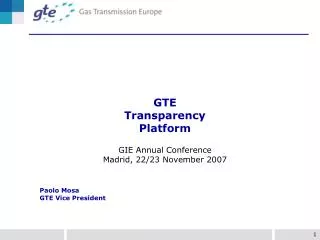
GTE Winter Outlook 2007 Brussels, January 8th 2008 Paolo Mosa GTE Vice-President Chairman of the GTE Transparency WG
Table of contents • Background • Updated results • Additional findings
Background • GTE WO presented to GCG on 25th October for the first time • The study showed the existence of a capacity/demand balance at EU level: • normal cold conditions • exceptional cold conditions • GTE invited to develop further analysis: • considering the depletion of national productions • identifying possible internal bottlenecks
Table of contents • Background • Updated results • Additional findings
Data improvements • Higher number of participating countries passing from 19 to 21 countries • National production figures reviewed to consider depletion of fields previous year flows in substitution of max tech capacity • Some figures updated by 5 countries on the basis of refined assumptions
Involved Countries EU members – data EU members – no data Non EU members
EU ''CAPACITY - DEMAND BALANCE'' (GWh/d) TOTAL CAPACITY INTERCONNECTED WITH IMPORT & LNG 14.634 TOTAL NATIONAL PRODUCTION 9.255 TOTAL STORAGE 11.702 35.591 TOTAL MARKET (NORMAL CONDITIONS) 27.419 TOTAL MARKET (EXCEPTIONAL CONDITIONS) 32.803 Updated European Balance
Table of contents • Background • Updated results • Additional findings
Additional findings • Single country balances normal cold conditions exceptional cold conditions • Integrated EU flow patterns • normal cold conditions • exceptional cold conditions
Single country balance + Import capacity at entry points + National production past flows* + Storage send out capacity** - Exit capacity to other countries Market demand forecast - • in normal condition • in exceptional condition Single Country balance = • in normal condition • in exceptional condition * to take into account the depletion of production fields ** considering the decrease of performances during the winter
Normal Conditions – Single country balances Balance ≥ 5% 0% < Balance < 5% Balance ≤ 0%
Normal conditions vs. Exceptional conditions No difference (E/N) ≤ 10% 10% < (E/N) < 30% (E/N) ≥ 30%
Exceptional Conditions – Single country balances Balance ≥ 0% - 5% < Balance < 0% Balance ≤ -5%
Single country balances vs Integrated EU flow patterns 3 critical single country balances experienced in normal conditions ?
Integrated EU flow patterns Identification of at least one pattern of flows between EU countries that respects the following conditions • Flows from non EU countries ≤ Entry point capacities • Flows between countries ≤ IPs capacities • Flows from storages ≤ send out capacity* • Flows from national productions ≤ past winter flows • Flows in exit from each country = national intakes – mkt demand * taking into account the decrease of performances during the winter
FIGURE LEGEND Entry/Exit flows from/to non EU countries Entry/Exit flows between EU countries Flows from National Production NP: Flows from Storage ST: Utilization ratio of the infrastructure % Utilization ratio < max reference value Utilization ratio = max reference value * IPs capacities are aggregated values (lesser of rule applies) Integrated EU flow pattern – Normal condition
FIGURE LEGEND Entry/Exit flows from/to non EU countries Entry/Exit flows between EU countries Flows from National Production NP: Flows from Storage ST: Utilization ratio of the infrastructure % Utilization ratio < max reference value Utilization ratio = max reference value * IPs capacities are aggregated values (lesser of rule applies) Integrated EU flow pattern – Exceptional condition
Key findings • 3 critical single country balances in normal cold conditions • Out of balance at national level solved considering flow patterns resulting from EU network integration • Flexibility already existing inside countries and in IPs both in normal and exceptional cold conditions • Future investments to follow increase in market demand and to improve flexibility at IPs