Download
1 / 48
490 likes | 741 Views
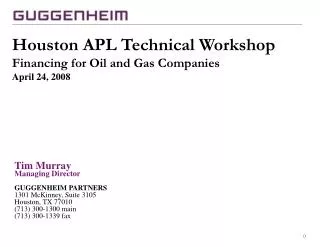
Houston APL Technical Workshop Financing for Oil and Gas Companies April 24, 2008. Tim Murray Managing Director GUGGENHEIM PARTNERS 1301 McKinney, Suite 3105 Houston, TX 77010 (713) 300-1300 main (713) 300-1339 fax. Financing for Oil and Gas Companies. Introduction of Guggenheim Partners

E N D
Houston APL Technical WorkshopFinancing for Oil and Gas CompaniesApril 24, 2008 Tim Murray Managing Director GUGGENHEIM PARTNERS 1301 McKinney, Suite 3105 Houston, TX 77010 (713) 300-1300 main (713) 300-1339 fax
Financing for Oil and Gas Companies • Introduction of Guggenheim Partners • Lending Basics • Reserve-Based Lending • Recent Trends in Energy Finance • Managing Leverage in a Volatile Commodity Environment • How to Attract a Financial Partner and Maintain a Financial Relationship
Lending Basics The Three C’s of Credit: Character Collateral Cashflow A deficiency in one cannot be overcome by an abundance of the other two.
Character • Credit references must checkout • Character references from industry are critical • Industry cycles test the mettle of every management team • Seek a financial partnership, not a transaction counterparty
Collateral • Ownership must be verified by good title • Correct title ownership must be reflected in the collateral valuation • Collateral valuation must be established by a recent, expert appraisal provided by an independent firm acceptable to the lender • A field audit and assessment of operating expertise may be required • The independent appraisal is often conservatively evaluated by the lender • Valuation can be supported by market transactions
Cashflow • Collateral appraisal and cashflow forecast should be consistent • Historical financial statements for the past three years should be provided • Financial statements should be compiled, reviewed, or audited by an independent accounting firm acceptable to the lender • Reasonable projections should be provided that demonstrate a range of financial outcomes possible over the term of the financing • The lender should receive periodic reports in a format consistent with the projections to facilitate performance monitoring
Reserve-Based Lending • Lender requirements: Credit checks and industry references • Complete biographical information on management • Documents evidencing corporate existence • Title report listing all interests • Any relevant marketing contracts • Recent independent engineering report • Historical lease-level operating statements • Any available environmental assessments • Historical financials • Disclosure of any material contingent obligations • Projections, development plans, strategy
Reserve-Based Lending • Engineering Report: Independent firm acceptable to the lender • Recent (or updated) report • Interests evaluated must match title held • At least 80% of total collateral evaluated • SPEE reserve classifications adhered to • LOE assumptions must match historical experience • Non-consent penalties and gas imbalances included • Gas contracts and/or hedging obligations reflected properly • Oil and gas price deck supplied by the lender (or SEC case) • Production taxes and ORRI deducted • COPAS charges segregated from LOE
Reserve-Based Lending • Proved Reserves: Reserves that have been proved to a high degree of certainty by engineering and geologic analysis. • Developed Recoverable from existing wells with current operating methods and expenses. • Producing Recoverable from completion intervals open to production • in existing wells. Wells are currently producing. • Non-Producing Wells which have been tested and completed, but are not • currently producing. • Behind Pipe Reserves behindthe casing of existing wells or at minor depths below the bottom of such wells. • Undeveloped Recoverable from wells yet to be drilled • or from an improved recovery project.
Reserve-Based Lending • Probable Reserves: Reserves supported by favorable engineering, but which are subject to some risk which prevents classification as proved. • Possible Reserves: Speculative reserves where risk is high.
CONTAINER CORP OF AMERICA 1-5 #2 DATE : 04/23/2008 Field: BIG ESCAMBIA CREEK TIME : 10:55:07 County: ESCAMBIA State: AL DBS : WDVG Operator: ESCAMBIA OPERATING CO SETTINGS : FLAT Reservoir: SMACKOVER SCENARIO : WDVG 1PROVED 1-DEV. PRODUCING G U G G E N H E I M P A R T N E R S R E S E R V E S A N D E C O N O M I C S AS OF DATE: 04/2007 --END-- WELL ---------------GROSS (8/8THS) PRODUCTION---------------- -----------------NET PRODUCTION (SALES)----------------- MO-YEAR COUNT OIL/COND. GAS(FWS) SULFUR NGL OIL/COND. GAS(SHRUNK) SULFUR NGL ------- ------- ----MBBLS---- ----MMCF---- ---M(UNIT)-- ----MBBLS---- ----MBBLS---- ----MMCF---- ---M(UNIT)-- ----MBBLS---- 12-2007 1.0 44.063 816.0 5.9 26.1 19.771 58.6 2.6 11.7 12-2008 1.0 55.141 1021.1 7.4 32.7 24.742 73.3 3.3 14.7 12-2009 1.0 51.282 949.7 6.8 30.4 23.010 68.2 3.1 13.6 12-2010 1.0 47.692 883.2 6.4 28.3 21.399 63.4 2.9 12.7 12-2011 1.0 44.353 821.4 5.9 26.3 19.901 59.0 2.7 11.8 12-2012 1.0 41.249 763.9 5.5 24.4 18.508 54.8 2.5 11.0 12-2013 1.0 38.361 710.4 5.1 22.7 17.213 51.0 2.3 10.2 12-2014 1.0 35.676 660.7 4.8 21.1 16.008 47.4 2.1 9.5 12-2015 1.0 33.179 614.4 4.4 19.7 14.887 44.1 2.0 8.8 12-2016 1.0 30.856 571.4 4.1 18.3 13.845 41.0 1.8 8.2 12-2017 1.0 28.696 531.4 3.8 17.0 12.876 38.2 1.7 7.6 12-2018 1.0 26.687 494.2 3.6 15.8 11.975 35.5 1.6 7.1 12-2019 1.0 24.819 459.6 3.3 14.7 11.136 33.0 1.5 6.6 12-2020 1.0 23.082 427.4 3.1 13.7 10.357 30.7 1.4 6.1 12-2021 1.0 21.466 397.5 2.9 12.7 9.632 28.5 1.3 5.7 S TOT 1.0 546.603 10122.3 72.9 323.9 245.261 726.7 32.7 145.3 AFTER 1.0 235.823 4367.1 31.4 139.7 105.814 313.5 14.1 62.7 TOTAL 1.0 782.426 14489.4 104.3 463.7 351.074 1040.2 46.8 208.0
--END-- ----------PRODUCT PRICE----------- -----------------GROSS REVENUES NET TO COMPANY-------------- --STATE & LOCAL TAX--- MO-YEAR OIL GAS SUL NGL OIL GAS SULFUR NGL TOTAL ADVALOREM SEVERANCE ------- -$/BBL- -$/MCF- --$/U-- -$/BBL- ----M$---- ----M$---- ----M$---- ----M$---- -----M$----- ----M$---- ----M$---- 12-2007 60.00 8.053 38.00 43.12 1186.266 471.778 100.174 505.203 2263.420 0.000 226.342 12-2008 62.80 9.143 38.00 44.99 1553.794 670.290 125.359 659.639 3009.083 0.000 300.908 12-2009 62.56 8.902 38.00 44.83 1439.506 606.916 116.584 611.282 2774.289 0.000 277.429 12-2010 61.88 8.448 38.00 44.38 1324.189 535.644 108.423 562.786 2298.495 0.000 253.104 12-2011 61.25 8.009 38.00 43.96 1218.958 472.286 100.834 518.438 2101.180 0.000 231.052 12-2012 60.65 7.552 38.00 43.55 1122.526 414.147 93.775 477.650 1919.729 0.000 210.810 12-2013 60.65 7.552 38.00 43.55 1043.950 385.157 87.211 444.215 1787.432 0.000 196.053 12-2014 60.65 7.552 38.00 43.55 970.873 358.196 81.106 413.120 1664.249 0.000 182.329 12-2015 60.65 7.552 38.00 43.55 902.912 333.122 75.429 384.202 1549.608 0.000 169.566 12-2016 60.65 7.552 38.00 43.55 839.708 309.803 70.149 357.307 1442.862 0.000 157.697 12-2017 60.65 7.552 38.00 43.55 780.929 288.117 65.238 332.296 1343.467 0.000 146.658 12-2018 60.65 7.552 38.00 43.55 726.263 267.949 60.672 309.035 1250.962 0.000 136.392 12-2019 60.65 7.552 38.00 43.55 675.425 249.192 56.425 287.403 1164.824 0.000 126.844 12-2020 60.65 7.552 38.00 43.55 628.145 231.749 52.475 267.284 1179.653 0.000 117.965 12-2021 60.65 7.552 38.00 43.55 584.175 215.527 48.802 248.575 1097.078 0.000 109.708 S TOT 61.15 7.995 38.00 43.89 14997.621 5809.873 1242.655 6378.435 26846.330 0.000 2842.858 AFTER 60.65 7.552 38.00 43.55 6417.597 2367.719 536.122 2730.775 12052.212 0.000 1205.221 TOTAL 61.00 7.861 38.00 43.78 21415.219 8177.592 1778.777 9109.210 38898.543 0.000 4048.079
--END-- ----------------EXPENSES NET TO COMPANY----------------- NET TOTAL ---FUTURE NET REVENUE--- -- 10.0% DISCOUNTED FNR--- MO-YEAR DIRECT VARIABLE RECOUP COPAS TOTAL CAPITAL ANNUAL CUMULATIVE ANNUAL CUMULATIVE ------- ----M$---- ----M$---- ----M$---- ---M$--- ----M$---- ----M$---- ----M$---- -----M$----- -----M$----- -----M$----- 12-2007 88.193 0.000 -19.901 8.653 303.286 0.000 1960.134 1960.134 1892.347 1892.347 12-2008 117.590 0.000 -24.905 11.537 405.131 0.000 2603.951 4564.085 2313.748 4206.095 12-2009 117.590 0.000 -23.161 11.537 383.395 0.000 2390.894 6954.979 1931.309 6137.403 12-2010 117.590 0.000 -21.540 11.537 360.692 0.000 1937.803 8892.782 1423.022 7560.426 12-2011 117.590 0.000 -20.032 11.537 340.147 0.000 1761.034 10653.816 1175.652 8736.078 12-2012 117.590 0.000 -18.630 11.537 321.307 0.000 1598.422 12252.238 970.089 9706.167 12-2013 117.590 0.000 -17.326 11.537 307.855 0.000 1479.577 13731.815 816.332 10522.499 12-2014 117.590 0.000 -16.113 11.537 295.344 0.000 1368.905 15100.720 686.612 11209.111 12-2015 117.590 0.000 -14.985 11.537 283.709 0.000 1265.899 16366.619 577.227 11786.338 12-2016 117.590 0.000 -13.936 11.537 272.888 0.000 1169.974 17536.592 484.990 12271.328 12-2017 117.590 0.000 -12.961 11.537 262.825 0.000 1080.642 18617.234 407.238 12678.566 12-2018 117.590 0.000 -12.053 11.537 253.466 0.000 997.496 19614.730 341.733 13020.299 12-2019 117.590 0.000 -11.210 11.537 244.762 0.000 920.062 20534.793 286.552 13306.851 12-2020 117.590 0.000 -10.425 11.537 236.668 0.000 942.986 21477.777 266.992 13573.843 12-2021 117.590 0.000 -9.695 11.537 229.140 0.000 867.938 22345.717 223.404 13797.247 S TOT 1734.458 0.000 -246.874 170.170 4500.612 0.000 22345.717 22345.717 13797.247 13797.247 AFTER 2841.769 0.000 -106.509 278.809 4219.290 0.000 7832.925 30178.645 1080.613 14877.859 TOTAL 4576.227 0.000 -353.383 448.979 8719.902 0.000 30178.641 30178.645 14877.860 14877.859 OIL GAS ECONOMIC RESULTS P.W. % P.W. M$ --------- --------- DIRECT OPERATING EXPENSE---------- -------------------------------- ------ -------- GROSS WELLS 0.0 1.0 $/WELL/MONTH 0.0 LIFE, YRS 38.92 5.00 19912.914 GROSS ULT. MB & MMF 2796.664 52294.301 $/MONTH 18000.0 UNDISC. PAYOUT, YRS. 0.00 10.00 14877.860 GROSS CUM. MB & MMF 2014.238 37804.938 MISC. EXP. $/BBL OR $/MCF--------- DISC. PAYOUT, YRS. 0.00 15.00 11972.858 GROSS REM. MB & MMF 782.426 14489.365 --OIL-- --GAS-- UNDISCOUNTED NET/INVEST. 0.00 20.00 10096.846 PRICE DIFFERENTIAL -4.650 0.240 VARIABLE 0.000 0.000 DISCOUNTED NET/INVEST. 0.00 25.00 8786.186 INITIAL NRI % 44.870 44.870 TRANSPORTATION 0.000 -0.280 RATE-OF-RETURN % 100.00 30.00 7817.355 INIT. WI % 54.440 54.440 SHRINK FACTOR 0.160 40.00 6476.431 60.00 4952.926 Perfs: -
Reserve-Based Lending • Lending Parameters: No more than 20% value concentration • Maximum of 25% non-producing value • Loan value < 60% of net present value • Loan payout with 40-50% of reserve value left • Loan payout within a reasonable period of time • Sensitivity test must be met
Reserve-Based Lending No more than 20% value concentration Risk is diversified such that the loss of one well or number of wells doesn’t jeopardize payback of the loan. Multiple market options for sale of production must be available, such that loss/curtailment of the sole market outlet doesn’t reduce production and cashflow for repayment.
Reserve-Based Lending Maximum of 25% non-producing value Loans based on 75% producing reserves provide sufficient cash flow to make interest payments and amortize principal. Maximum of 25% non-producing provides some loan value for development capital to convert non-producing reserves to producing, thereby maintaining or increasing loan value.
Reserve-Based Lending Loan Value < 60% of net present value Loan values limited to 60% of value provides the lender some protection against the risks of reserve-based lending. If the lender were to advance 100% of the value, there would be no margin for error in reserve estimation, operational problems, or declining oil and gas prices. The 60% value limitation also provides the borrower some incentive to perform on the loan to preserve the residual value of the collateral after retirement of the loan obligation.
Reserve-Based Lending Loan payout with 40-50% of reserve value left Loan payout achieved with 40-50% of the value remaining is the lender’s principal protection against price volatility and other reserve-based lending risks. If prices decline or production is delayed, the time to payout may be extended, but the lender still has reserve value left to cover the loan. The reserve tail also provides the borrower some incentive to perform on the loan to preserve the residual value of the reserves after the lender is repaid.
Reserve-Based Lending Loan payout within a reasonable period of time Payout within a reasonable period of time is prudent lending. No one can accurately predict what will happen 5 to 7 years from inception of a loan. Although some long life reserves may theoretically support a repayment period beyond 5 to 7 years, most lenders would rather refinance the reserves within a shorter time period than commit for such an extended period of time.
Reserve-Based Lending Sensitivity test must be met Each lender has their own unique sensitivity test that attempts to assess the loan value in a downside price scenario. The test is usually performed by depressing the oil and gas prices used in the base case analysis by some dramatic amount to assess the risk of the loan defaulting. This test often identifies marginal and high operating cost properties that are not commercial at depressed prices. Example: Depress the base case price deck by 25% for one year; escalate prices back to the base case level; and determine the net present value of the reserves. The net present value must exceed the loan value to pass the test.
Reserve-Based Lending • Lending Risks: Mechanical • Reservoir • Market • Environmental • Financial • Legal
Reserve-Based Lending • Mechanical Risks: Casing collapse • Parted tubulars and/or rod strings • Fish /junk in the wellbore • Sandup/formation plugging • Poor cement bonding • Excessive drilling/workover expense • Unexpected and recurring maintenance expense
Reserve-Based Lending • Reservoir Risks: Dry holes • Water encroachment • Depletion • Drainage • Gas/water coning • Delayed waterflood/CO2 response • Thief zones • Early injector breakthrough • Retrograde condensation
Reserve-Based Lending • Market Risks: Oil and gas price volatility • Market accessibility for remote production • High electricity expense • Pipeline curtailments • Transportation/gathering fees • Basis/quality differentials
Reserve-Based Lending • Environmental Risks: Blowout • Regulatory agency shut-ins/fines • Remediation expense • Produced water disposal expense • Litigation
Reserve-Based Lending • Financial Risks: Inadequate insurance • Fraud • Excessive G&A expense • Dividends, distributions, and insider loans • Speculative hedges • Non-consent penalties • Gas contract imbalances • Liquidity
Reserve-Based Lending Legal Risks: Title failure Violation of lease terms and forfeiture Top leasing Unperfected collateral position Overreaching bankruptcy trustees Trial by the hometown jury Usury Loan structure flaw Royalty owner litigation M&M liens Tax liens
Commercial Bank Debt • Traditional advance rates against mostly PDP, some PDNP+PUD (20-30%) • Borrowing base controls advances • First lien on collateral, recourse to the company • Covenants: TNW, CR, interest coverage, max debt/ebitda • Minimal fees • Pricing grid based on usage • Revolver and term loan • Hedging optional Mezzanine Debt • High advance rates against PDP, often all PUD reserves • Advances against AFEs during development, borrowing base control also • First or second lien on development, non-recourse to company • Asset coverage/tail test, but few/no financial covenants • Fees up front and prepayment fees, plus an equity kicker (ORRI or NPI) • Fixed interest spread, 100-300 bp over bank debt (liquidity discount for large deals) • Advancing term loans • Monthly cash flow sweep to amortize • Hedging required
Private Equity • Focused strategy and use of proceeds • Equity investment a function of target return and leverage assumed • No collateral, but could have a liquidation preference • Performance covenants only • Hedging encouraged • Management must deliver a preferred return before backing in for their promote • No amortization • Equity investor controls most major decisions, including replacing management Mezzanine Debt • Flexible use of proceeds • High advance rate against proven reserves • First or second lien on development assets but non-recourse to the company • Asset coverage/tail test, but few/no financial covenants • Hedging required • Fees up front and prepayment fees, plus an equity kicker (ORRI or NPI) • Fixed interest spread, 100-300 bp over bank debt (liquidity discount for large deals) • Advancing term loans • Monthly cash flow sweep to amortize • No management input or control
$/Bbl Source: Tristone Capital and NYMEX (3/22/07)
$/MM Btu Source: Tristone Capital and NYMEX (3/22/07)
Production Payments • Production payments serve as loan collateral • Non-recourse to the producer • Tenor is dependent on production profile • Based on PDP reserves typically • 70 - 90% advance, dependent on lease operating expenses • Commodity price hedging is essential • Expensive: imputed Fees and interest rate • highly structured = high legal expense
Energy Capital Provider Spectrum Equity Mezzanine Senior Guggenheim Energy Energy “Mezzanine” Firms GasRock;GE Energy; Laminar Direct; Macquarie; NGP Capital Resources; Petrobridge; Prospect Energy; TCW; Wells Fargo Energy Capital; Goldman Sachs E&P Capital Resource Funds/Asset Aggregators Merit Energy; Quantum Resources; Celero; LimeRock; Sheridan Resources Stretch Senior Debt Providers American Capital; CIT; Foothill; NGP Capital Resources; SilverPoint; Power & Infrastructure/Alternative Assets ArcLight Capital; D.E. Shaw; First Reserve; Haddington Ventures; MetalMark Capital; Quantum Infrastructure Fund Traditional Energy Banks Amegy Bank; Bank of America; Bank of Oklahoma; Bank of Scotland; BNP Paribas; Capital One; Citigroup; Comerica Bank; Compass Bank; Deutsche Bank; Fortis; Frost Bank; GE / Merrill Lynch; Guaranty Bank; JPMorgan; Texas Capital; RBS; UBOC; US Bank; Wachovia; Wells Fargo; WestLB; Whitney Bank Energy-Focused Private Equity Funds Avista Capital; Carlyle / Riverstone; DB Zwirn; EnCap Investments; Energy Spectrum; First Reserve; Greenhill Capital; Kayne Anderson; Lime Rock Partners; Pine Brook Road Partners; Post Oak Partners; Quantum Energy; Natural Gas Partners; SCF Partners; Warburg Pincus; Yorktown Partners
Energy Finance Market • Commercial Banks: challenged to maintain and grow loans with new and aggressive competition, restrictive loan policies, and declining loan yields. Some banks continue to aspire to be investment banks. • Investment Banks:enjoying a robust M&A market and receptive public markets. Some investment banks aspire to be commercial banks. • Private Equity: record levels of private equity capital is competing for limited management teams in a robust M&A market with high commodity pricing and rising F&D costs. Current investors may be challenged to realize the same level of returns as the predecessor funds. • Mezzanine Firms: new entrants and retooled teams have swelled the ranks to over two dozen firms, up from 3 or 4 survivors in 2001-02. Pressure to build portfolios has resulted in some of the same mistakes being made all over again. • Institutional Loan Investors: havediscovered the Term B and Second Lien loan product. High yield lending in 1Q’07 rose a record amount fueled primarily by hedge funds, mutual funds, and CLOs. For deals in the $100 million range that accessed this market, loan pricing was bid down and covenant light structures were over-subscribed overnight. Today, some firms that were heavily engaged in leveraged lending with a mark-to-market balance sheet are liquidating energy loans to meet investor demands for redemptions. • Clients: have never enjoyed such an abundance of capital. The challenge is to stay focused on your strategy and not pursue an idea just because you can raise the capital.
Public High Yield Market • The Leveraged Finance capital markets experienced a major correction in the second half of 2007 • Record forward calendar of committed transactions built through the first half of the year with aggressive structures and pricing weighed upon new issue underwritings • Supply has continued to outpace demand into 2008, so prospective deals need to be differentiated to attract buyers • Problems started in the Leveraged Loan market following the collapse of structured vehicles that were a major driver of liquidity • Formation of new CLOs effectively stalled following sub-prime and asset-backed crisis and inability to syndicate AAA tranches and source equity • High Yield market has tracked the Leveraged Loan market on a relative value basis without suffering from similar technical issues • Liquidity was tested by some of the largest transactions ever, including First Data and TXU • Energy credit availability since 2Q 2007, while more constrained in the second half of 2007 in sympathy with the broader market, remains one of only a few select industry sectors successfully accessing the leveraged markets across the credit spectrum • The Merrill Lynch Energy index, comprised of energy credits rated CCC through BB, realized yield and spread increases of 1.07% and 221 bps, respectively, since June 2007, substantially less than its broad-based index counterparts • Since mid-December 2007, energy issuance has comprised the majority of the high yield calendar/high yield primary issuance, with two energy transactions pricing (upstream and services) and two of three pending transactions also focused in the upstream energy sector
Will the tide continue to rise? A rising tide lifts all boats… It’s only when the tide goes out that you discover who’s been swimming naked.
Managing Leverage in a Volatile Commodity Environment • Price Hedging: perhaps single greatest risk in a leveraged deal can be insured • Amortization: reducing leverage through monthlycash sweep or scheduled payments instills discipline and quickly reveals discrepancies between projections and reality • Equity Support: greater willingness to assume more risk when the owner has “skin in the game” and/or ability to invest additional capital • Equity Backstop: second best thing to skin in the game is a properly structured call/put arrangement to inject equity with the occurrence of certain events • Choose the Right Partner: While a financial institution is very focused on the character of management, management should be confident their chosen financial partner understands their business and is committed to it through good times and bad
Managing Leverage in a Volatile Commodity Environment • Balancing Financial and Operating Leverage: • High financial leverage should be matched with low “operating leverage” (high PDP component, long and predictable decline characteristics, low operating cost, well defined drilling targets, ownership of service assets to reduce cost and control the pace of capital deployment) • Deal Structures: • Acquisitions funded with stock or contingent payments based on realization of some upside • Predicated strictly on PDP (all other categories represent cushion/upside) • Liquidity to manage small or short duration upsets • Bridge components with well-defined take outs (but fully amortizing capability)
How to Attract a Financial Partner • Consistent track record • Regional / nationally-recognized engineering firm • Competent financial and operating staff • Reviewed / audited financial statements • Clean, defensible title • Clear, definable strategy
No surprises Provide financial rewards Develop a multi-faceted relationship Loyalty How to Maintain a Financial Relationship
Capital at a reasonable cost Responsiveness Ideas Contacts/referrals Merger/acquisition opportunities What to Expect from a Financial Partner
Houston APL Technical WorkshopFinancing for Oil and Gas CompaniesApril 24, 2008 Tim Murray Managing Director GUGGENHEIM PARTNERS 1301 McKinney, Suite 3105 Houston, TX 77010 (713) 300-1300 main (713) 300-1339 fax