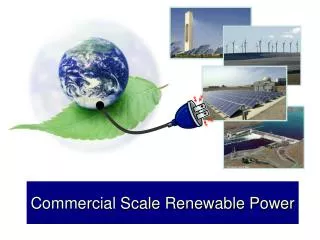
Commercial Scale Renewable Power
310 likes | 601 Views
Commercial Scale Renewable Power. CO 2 is the most important greenhouse gas driving climate change Primary source is burning fossil fuels ( ancient sunshine – geologic carbon) Increasing CO 2 levels: 388 ppm & rising rapidly One of the largest sources is burning of coal for electrical power

Commercial Scale Renewable Power
E N D
Presentation Transcript
CO2 is the most important greenhouse gas driving climate change • Primary source is burning fossil fuels (ancient sunshine – geologic carbon) • Increasing CO2 levels: 388 ppm & rising rapidly • One of the largest sources is burning of coal for electrical power • Our rapid emissions of ancient carbon has set the cycle out of balance
Clean Energy Future • Energy efficiency and renewable energy production are the keys to building a clean energy future • Reducing demand by improving efficiency buys time to bring renewable energy to maturity as a competitive option • All energy options have pros & cons; we need to factor in all costs (both monetary and environmental) Coal Plant Nuclear Plant Renewable Energy Technologies
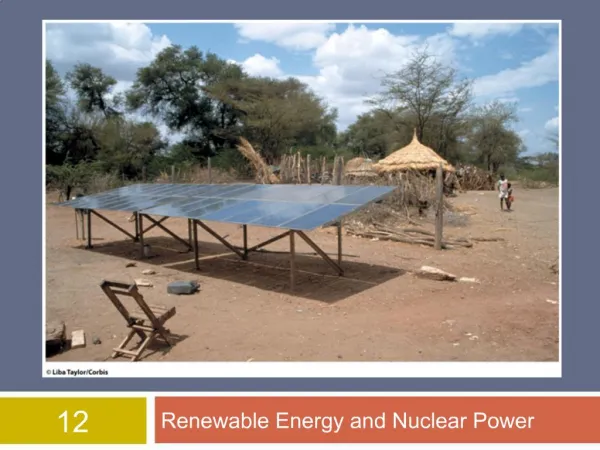
What is renewable energy? Renewable energy (e.g. electrical power) is generated from natural resources that are inexhaustible and naturally replenished (renewed) at a rate comparable to its use • Which of the following power sources are renewable? • Solar and Wind • Nuclear • Coal • a & b • All of the above
Commercial Scale Renewable Power Diverse technologies; varying maturity and viability 2008: 280 GW (excluding hydroelectric dams), up 16% from 2007 Most based on traditional turbine generators Mature & competitive: hydroelectric, geothermal & biomass Deployed and growing: Wind & solar power Developmental: Hydrokinetic power (tidal and wave) There is no panacea for our energy challenges all options have pros & cons; we need to consider all factors Watt – measurement unit for electrical flow 1 KW – 1 kilowatt = 1000 watts 1 MW – 1 megawatt = 1 million watts 1 GW – 1 gigawatt = 1 billion watts
Hydroelectric Power • 777 GW worldwide • 19% global electricity • >50% renewable power • Base load power • available 24 - 7 • low cost & maintenance • Renewable technologies have “pros” & “cons” • land inundation • fish and habitat issues • most available hydro resources being used • population displacement Itaipu Dam – World’s largest On Brazil/Paraguay Border
Use steam from underground geothermal sources Base load power plants 24 countries produce 10 GW Top 5: US, Philippines, Indonesia, Mexico, & Italy 70 countries use 28 GW of steam heat Significant untapped potential 100 new sites available in U.S. western states (~13 GW) Issues Corrosive gases; pollutants Subsidence Earthquake triggers Geothermal Power Nesjavellir Power Plant Iceland The Geysers Complex California
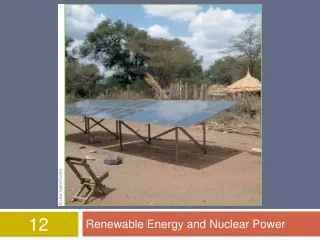
Biomass Power • Fueled by organic biomass from plant materials and animal by-products • Wood and paper production • Food production & processing waste • Trees and grasses • Gaseous fuels from solid biomass, animal wastes, and landfills • U.S. produces ~10,000 MW • 6200 MW wood & agricultural waste • 3200 MW municipal solid waste, landfills • 600 MW other [USDOE 2006] • Issues • Emissions (nitrous oxides) McNeil Generating Station, 50 MW Burlington, VT Feedstock: Hybrid Willows
Local Biomass Plants • Farm Power Northwest manure digester (Rexville) • 750 KW generator • Start fall 2009 • Electricity purchased by PSE Green Power • Sierra Pacific (Hwy 20) cogeneration plant • 30 MW generator fueled by sawdust waste • Power is used onsite for operations and excess sold to PSE Green Power
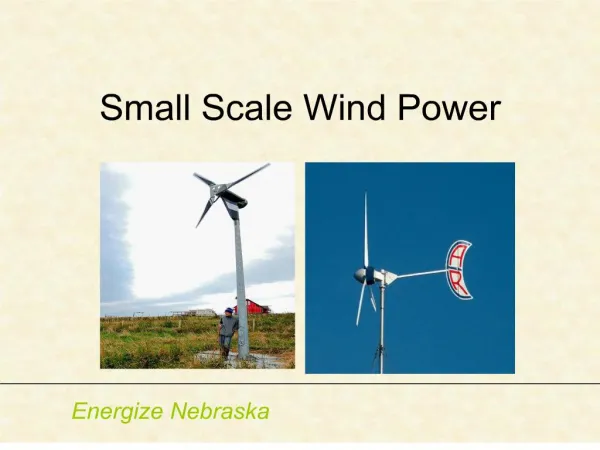
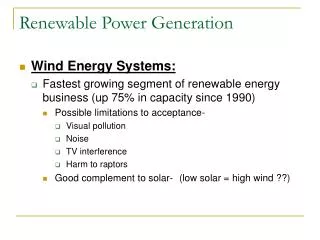
Wind Power • Fastest growing and cost competitive • Turbine technology improving steadily • Today 2+ MW and growing to 5MW • Not base load • Available when the wind blows • No current storage • Issues • Birds • Noise • Aesthetics (views) “A single 1-MW turbine displaces 1,800 tons of carbon dioxide, the primary global warming pollutant, each year (equivalent to planting a square mile of forest) …” American Wind Energy Association
Wind Power Global • 2009: 160 GW capacity up 30% • Trend: worldwide capacity doubles in 3 years • US has most installed capacity - today • China is doubling capacity annually; 2009 up 14 GW World Wind Energy Association
Wind Power Europe Horns Rev - Denmark • Europe leads globally • ~5% power from wind 2009 • 39% of new installations • 3% EU wind is offshore • EU 2020 Goal: 20% renewable power • Wind power key to energy independence • Germany, Spain are largest producers • Denmark produces 20% of power from wind • Large offshore wind farms
US Top 5 States #1 Texas – 3352 MW #2 California – 2376 MW #3 Iowa – 967 MW #4 Minnesota – 897 MW #5 Washington – 818 MW TOTAL INSTALLED U.S. WIND ENERGY CAPACITY: 13 GW as of June 30, 2007 American Wind Energy Association
US Top 6 States #1 Texas – 9506 MW #2 Iowa – 3670 MW #3 California – 2723 MW #4 Oregon – 1920 MW #5 Washington – 1908 MW # 6 Illinois – 1848 MW U.S. WIND ENERGY CAPACITY: 35 GW as of 6/30/09 10GW (5700 turbines) added 2009 Saves 62 M tons CO2 American Wind Energy Association (AWEA) National Renewable Energy Laboratory (NREL)
Washington Wind Power • Washington currently has 1908 MW installed capacity* State Line (Walla Walla) 177 MW Nine Canyon (Benton County) 96 MW Hopkins Ridge (Columbia County) 157 MW Big Horn (Klicitat County) 200 MW Wild Horse (Kittitas County) 273 MW White Creek (Klicitat County) 205 MW Marengo (Dayton) 210 MW Goodnoe Hills (Klicitat County) 94 MW Windy Point (Klicitat County) 399 MW Harvest (Cowlitz County) 99 MW *AWEA Wild Horse Big Horn
Hydrokinetic “Ocean” Power • Two categories of technologies convert ocean energy to electricity • Tidal Power Systems • Wave Power Systems • Marine environments pose harsh environmental challenges (e.g. salt corrosion, storms) • A wide variety of approaches • Maturity varies from conceptual designs to full scale prototypes • There are a few full-scale power installations (Pelamis; Portugal)
Tidal Barrage Plant (240 MW; 1966) La Rance River, France Tidal Power • Harnessing power of tidal flow with two types of technologies • Tidal barrage (dam) • Tidal turbines • La Rance Station oldest and largest barrage unit • Korea building world’s largest tidal barrage plant • First six tidal turbines installed in NY’s East River • first grid tied tidal turbine system • Plans 100 to 300 turbine farm generating 10+ MW South Korean Sihwa Power Plant (254MW) South Korean Uldolmok Power Plant (1 MW) Roosevelt Island Tidal Energy Project East River NY, NY (6 - 35 KW turbines)
Tidal Power in our neighborhood • Snohomish PUD & US Navy planning tests in Puget Sound • Navy will test tidal turbines off Marrowstone Island • One year pilot test then remove and sell turbines • PUD will test 3 Open Hydro turbines off Admiralty Head Marrowstone Island Indian Island Naval Base Admiralty Head
Tidal Power – Coming Attractions Clean Current Tidal Turbine SeaGen 1.2 MW Tidal Turbine Strangford Lough, Ireland Blue Ocean Tidal Turbine Severn Tidal Fence
Wave Power • Wave energy has the potential to generate more power than tides • WA & OR have best wave potential in lower 48 states • Design types include: • Floats, buoys, and pitching devices • Oscillating water column • Tapered channel and overhead topping • Wave farms being developed in Scotland, England, Portugal Atlantic City, NJ, 40 KW; Oahu, HIU.S. Marine Base up to 1MW Oscillating water column plant 250KW - Germany Wave Dragon prototype (shown) 70 MW in 2010Pembrokeshire, England
Wave Power Operating Limpet Power Station 500 KW, UK (OWC) Pelamis Wave Energy Project 2.25 MW Portugal (Pitching system, commercially available) Source: BBC News
Wave Power – Coming Attractions Stingray Wave Generator Oyster Wave Sea Water Piston Finivera Wave Buoy Wavebob Buoy
Solar Power Generation • Two types of solar power technologies are used on a commercial scale today • Concentrated solar power (CSP, thermal) • Photovoltaic power (direct conversion)
At year end 2009, the U.S. had 2,108 MW installed solar electric capacity 1,676 MW of PV power 432 MW of CSP power Issues • Solar incidence varies • Acreage required • Water (CSP) • Cost (PV)
CSP Parabolic Trough • Parabolic mirror focuses sunlight on fluid filled tube • Trough tilts to follow sun • ~5 acres for 1MW power • Water use is major issue • Smaller scale and superheated compressed air being developed • US has 432 MW installed • US SEGS (CA) is largest • Spain largest producer • Morocco, Algeria, Italy Kramer Junction, California
CSPTower PS-10 Seville, Spain Sierra Sun Lancaster, CA • Reflectors focus sunlight onto target generating superheated fluids (water, oil, molten sodium) within the central collector • Hot fluids can be stored in insulated tanks allowing extended operation (when sun isn’t shining) • Spain has largest number of installations • Solar Tres (Andalusia, 15MW sodium design, 2008) and PS-10/20 (Seville, 20 MW, direct steam design, 2007/2009)
Photovoltaic (PV) Power Waldpolenz Germany 40MW • PV arrays directly convert solar energy to electricity • Germany has been world leader in development and installation • Most plants are 20 MW to 60 MW • Integrate with farming/grazing land • Install on residential & commercial buildings (distributed generation) • Installations increase ~20% per year
Photovoltaic (PV) Power Worldwide • 23GW worldwide • Europe 10GW • Germany 3.8 GW • 2009 increases • 3.8 GW Europe • Japan 484 MW • US 475 MW
Distributed PV Power • Using existing commercial, governmental, and residential rooftops and parking lots for distributed grid-tied power
$1.4B $5.5B $650M $6B $4.6B $2.8B McNeil Biomass Plant Burlington, VT 50 MW, $67M Comparing Zero Carbon Options Proposed Tide Turbine SF Bay 1MW, ~$5.5M 20X 1000X BEST BUY Nuclear Plant 1,000+ MWe$5B to 9B* 5X 6.7X Big Horn 200 MW 11,000 Acres, ~$130M Klicitat County, WA *Does not include subsidies, fuel, waste disposal & decommissioning Kramer Junction CA Solar Trough, 150 MW, 1000 acres, ~$900M 100X 25X Waldpolenz Germany 250 acres, 40MW, $185M PS-10 Solar Tower Spain 10 MW, 150 acres, $28M